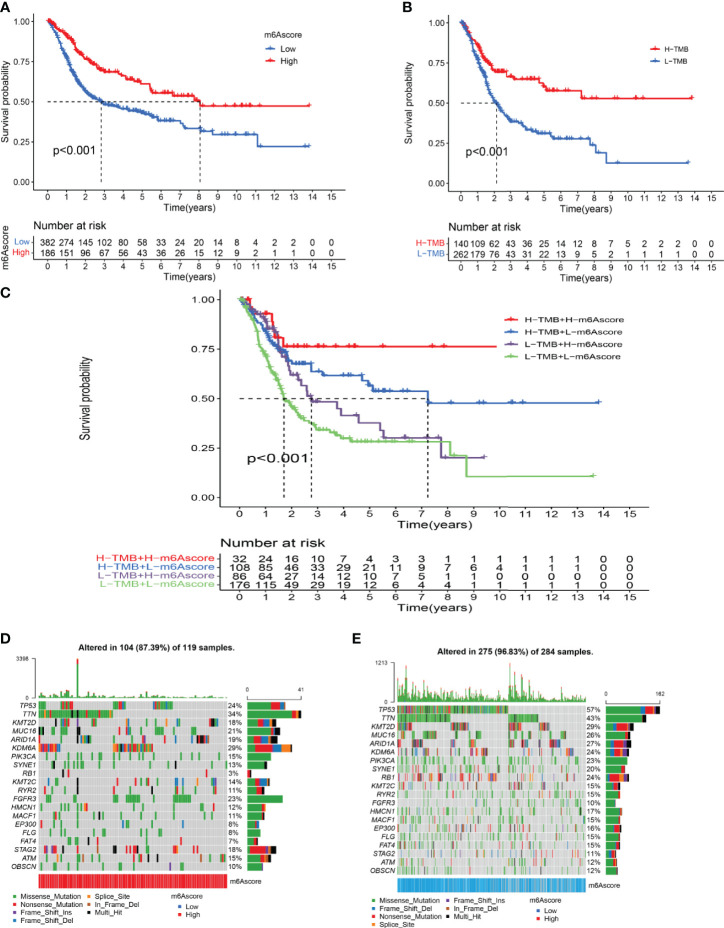
Figure 5.
Characterization of m6A modifications in tumor somatic mutation. (A) Survival analysis of the high-m6A score group and low-m6A score group. (B) Survival analysis of tumor mutation burden. (C) Survival analysis of TMB combined with m6A score. (D) Waterfall chart of the high-m6A score group. (E) Waterfall chart of the low-m6A score group.

