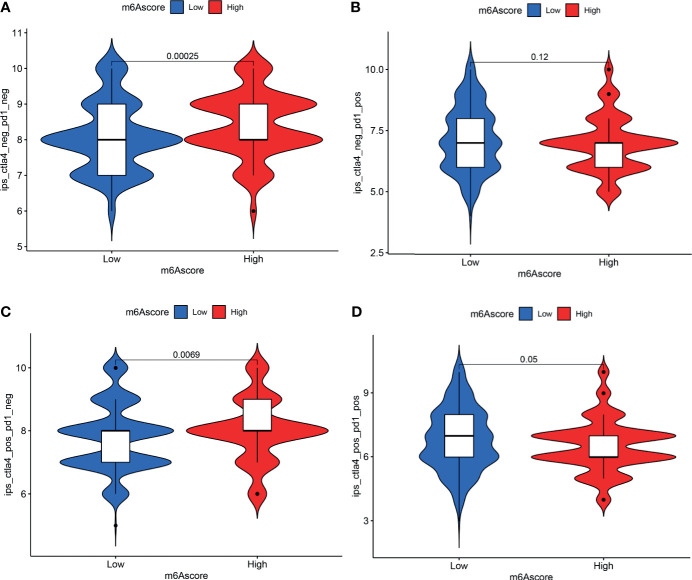
Figure 7.
Analysis of m6A modification patterns in anti-PD-L1 and CTLA-4 immunotherapy. (A) Differential analysis for low-m6A score group and high-m6A score group in CTLA-4 negative and PD-L1 negative therapy. (B) Differential analysis for low-m6A score group and high-m6A score group in anti-PD-L1 immunotherapy. (C) Differential analysis for low-m6A score group and high-m6A score group in anti-CTLA-4 immunotherapy. (D) Differential analysis for low-m6A score group and high-m6A score group in anti-PD-L1 combined with CTLA-4 immunotherapy.

