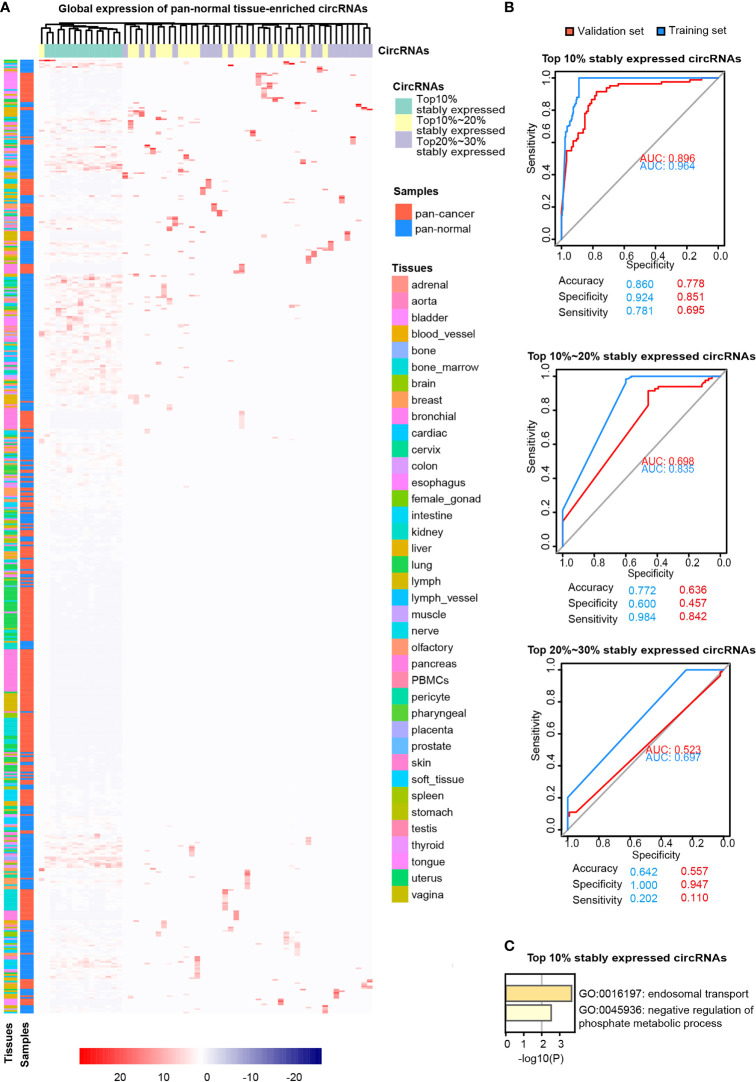
Figure 3.
Pan-normal tissue-enriched circRNAs. (A) Heatmap illustrating the expression of pan-normal tissue-enriched circRNAs selected by LASSO regularization analysis among the top 10%, top 10%–20%, and top 20%–30% stably expressed circRNAs. Turquoise: top 10%; yellow: top 10%–20%; gray: top 20%–30%. Red: pan-cancer tissues; blue: pan-normal tissues; rainbow: tissue types. (B) Receiver operating characteristic curve showing the sensitivity of pan-normal tissue-enriched circRNAs to classify pan-cancer and pan-normal tissues via the support vector machine. The top 10%, top 10%–20%, and top 20%–30% of stably expressed circRNAs were separately analyzed. Blue: training set; red: validation set. (C) Functional enrichment of the host genes of pan-normal tissue-enriched circRNAs among the top 10% of stably expressed circRNAs.

