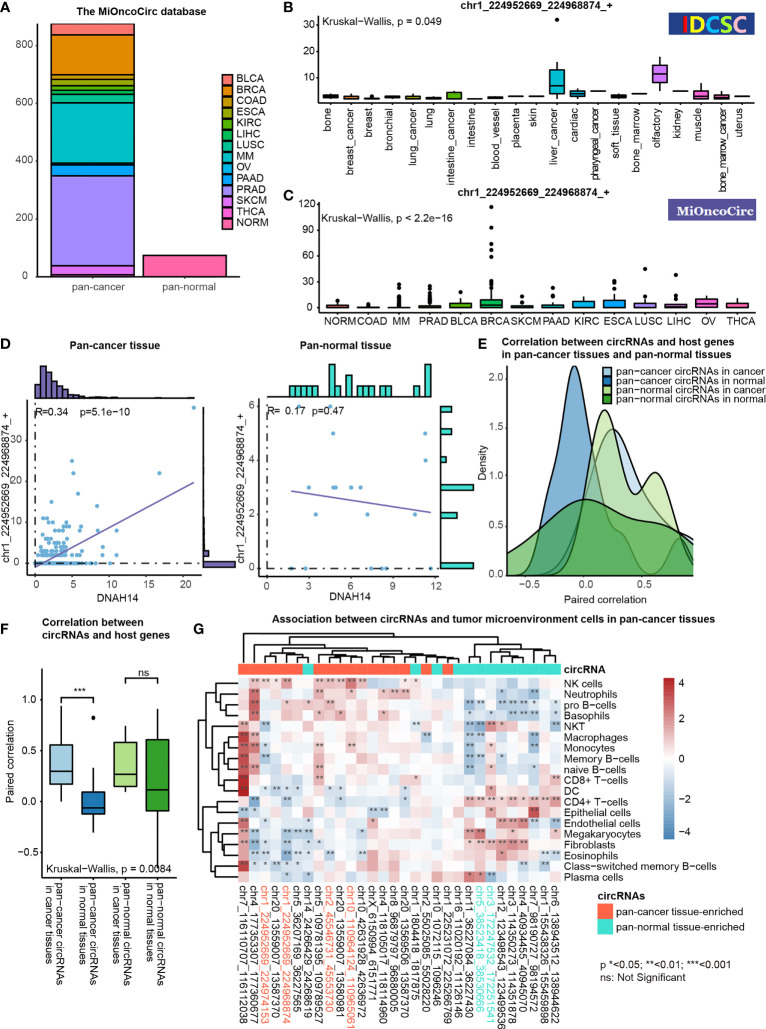
Figure 6.
Functional association studies of pan-cancer tissue-enriched circRNAs using MiOncoCirc data. (A) Pan-cancer and pan-normal samples provided by the MiOncoCirc database including multiple myeloma (MM), colon adenocarcinoma (COAD) prostate adenocarcinoma (PRAD), bladder urothelial carcinoma (BLCA), breast invasive carcinoma (BRCA), skin cutaneous melanoma (SKCM), pancreatic adenocarcinoma (PAAD), kidney renal clear cell carcinoma (KIRC), esophageal carcinoma (ESCA), lung squamous cell carcinoma (LUSC), liver hepatocellular carcinoma (LIHC), ovarian serous cystadenocarcinoma (OV) and thyroid carcinoma (THCA), together with normal controls (NORM).d (B) Expression of chr1_224952669_224968874_+ in the samples collected by the CSCD database. (C) Expression of chr1_224952669_224968874_+ in the samples collected by the MiOncoCirc database. (D) Correlation between chr1_224952669_224968874_+ level and DNAH14 expression in pan-cancer and pan-normal tissues. (E) Distribution of paired correlation scores between pan-cancer tissue-enriched or pan-normal tissue-enriched circRNAs and host genes in pan-cancer tissues and pan-normal tissues; (F) Alteration of paired correlation scores between pan-cancer tissue-enriched or pan-normal tissue-enriched circRNAs and host genes during oncogenesis; (G) Correlation between pan-cancer tissue-enriched circRNAs and the abundance of tumor microenvironment cells in pan-cancer tissues. Red: high Spearman correlation score; blue: low Spearman correlation score.

