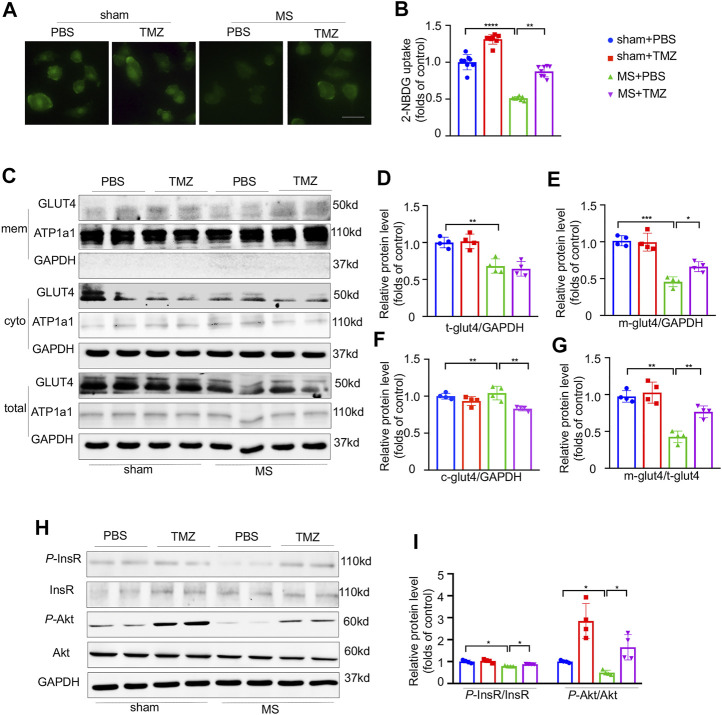
FIGURE 5.
Pressure overload-induced impairment of insulin signaling was preserved by Trimetazidine in vitro. (A,B) The representative 2-NBDG fluorescence images and its quantitative analysis of H9C2 cell line. Scale bar = 100 um. (C–G) Representative GLUT4 western blots in NRCMs and correspondence quantitative analysis, Na-K-ATPase was used as the membrane loading control, and GAPDH for cytoplasm loading control. M-GLUT4, GLUT4 in the membrane. C-GLUT4, GLUT4 in the cytoplasm. T-GLUT4, total GLUT4. (H,I) The protein levels of InsR, Akt and their phosphorylation states. Graphical data are shown as mean ± SEM. Two-way ANOVA was used for analysis. *p < 0.05, **p < 0.01, ***p < 0.001, ****p < 0.0001, vs indicated group. MS, Mechanical stretch; TMZ, Trimetazidine.

