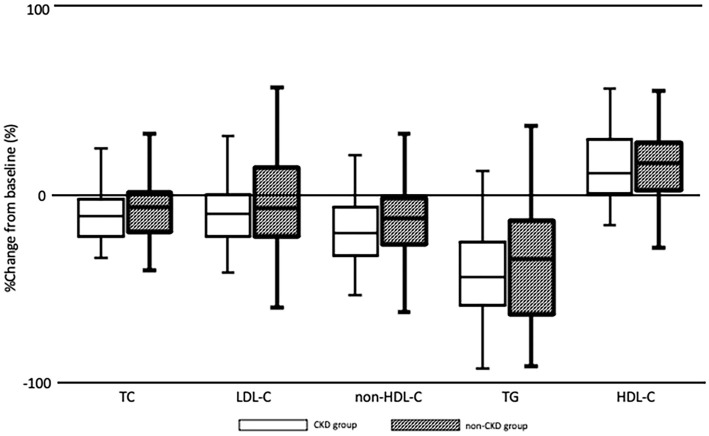
Figure 1.
Box plots showing the percent change from baseline to week 24 regarding the serum lipid levels as demonstrated by the Mann-Whitney U test. A p value of 0.05 was considered to be significant. Boxes show the medians and interquartile ranges with the lowest and highest values being shown above and below each box. This figure illustrates the findings of efficacy analyses, which found no significant differences between the CKD and non-CKD groups. CKD: chronic kidney disease, TC: total cholesterol, LDL-C: low-density lipoprotein cholesterol, non-HDL-C: non-high-density lipoprotein cholesterol, TG: triglycerides, HDL-C: high-density lipoprotein cholesterol

