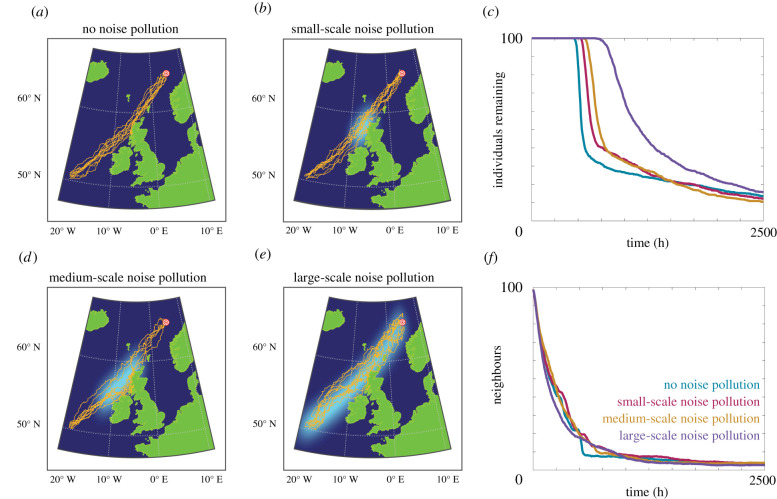
Figure 8.
Comparison of migration from 50°N, 19°W to 65°N, 5°E in the East Atlantic Ocean for 100 individuals in the presence of (a) no noise pollution, (b) small-scale noise pollution, (d) medium-scale noise pollution or (e) large-scale noise pollution. (c) The number of individuals remaining in the system over time. (f) The average number of neighbours within the perceptual range. Parameters used are , α = β = 0.5, rmax = 114 km, s = 8 km h−1. Orange lines are a subset of simulated individual trajectories.

