Figure 1:

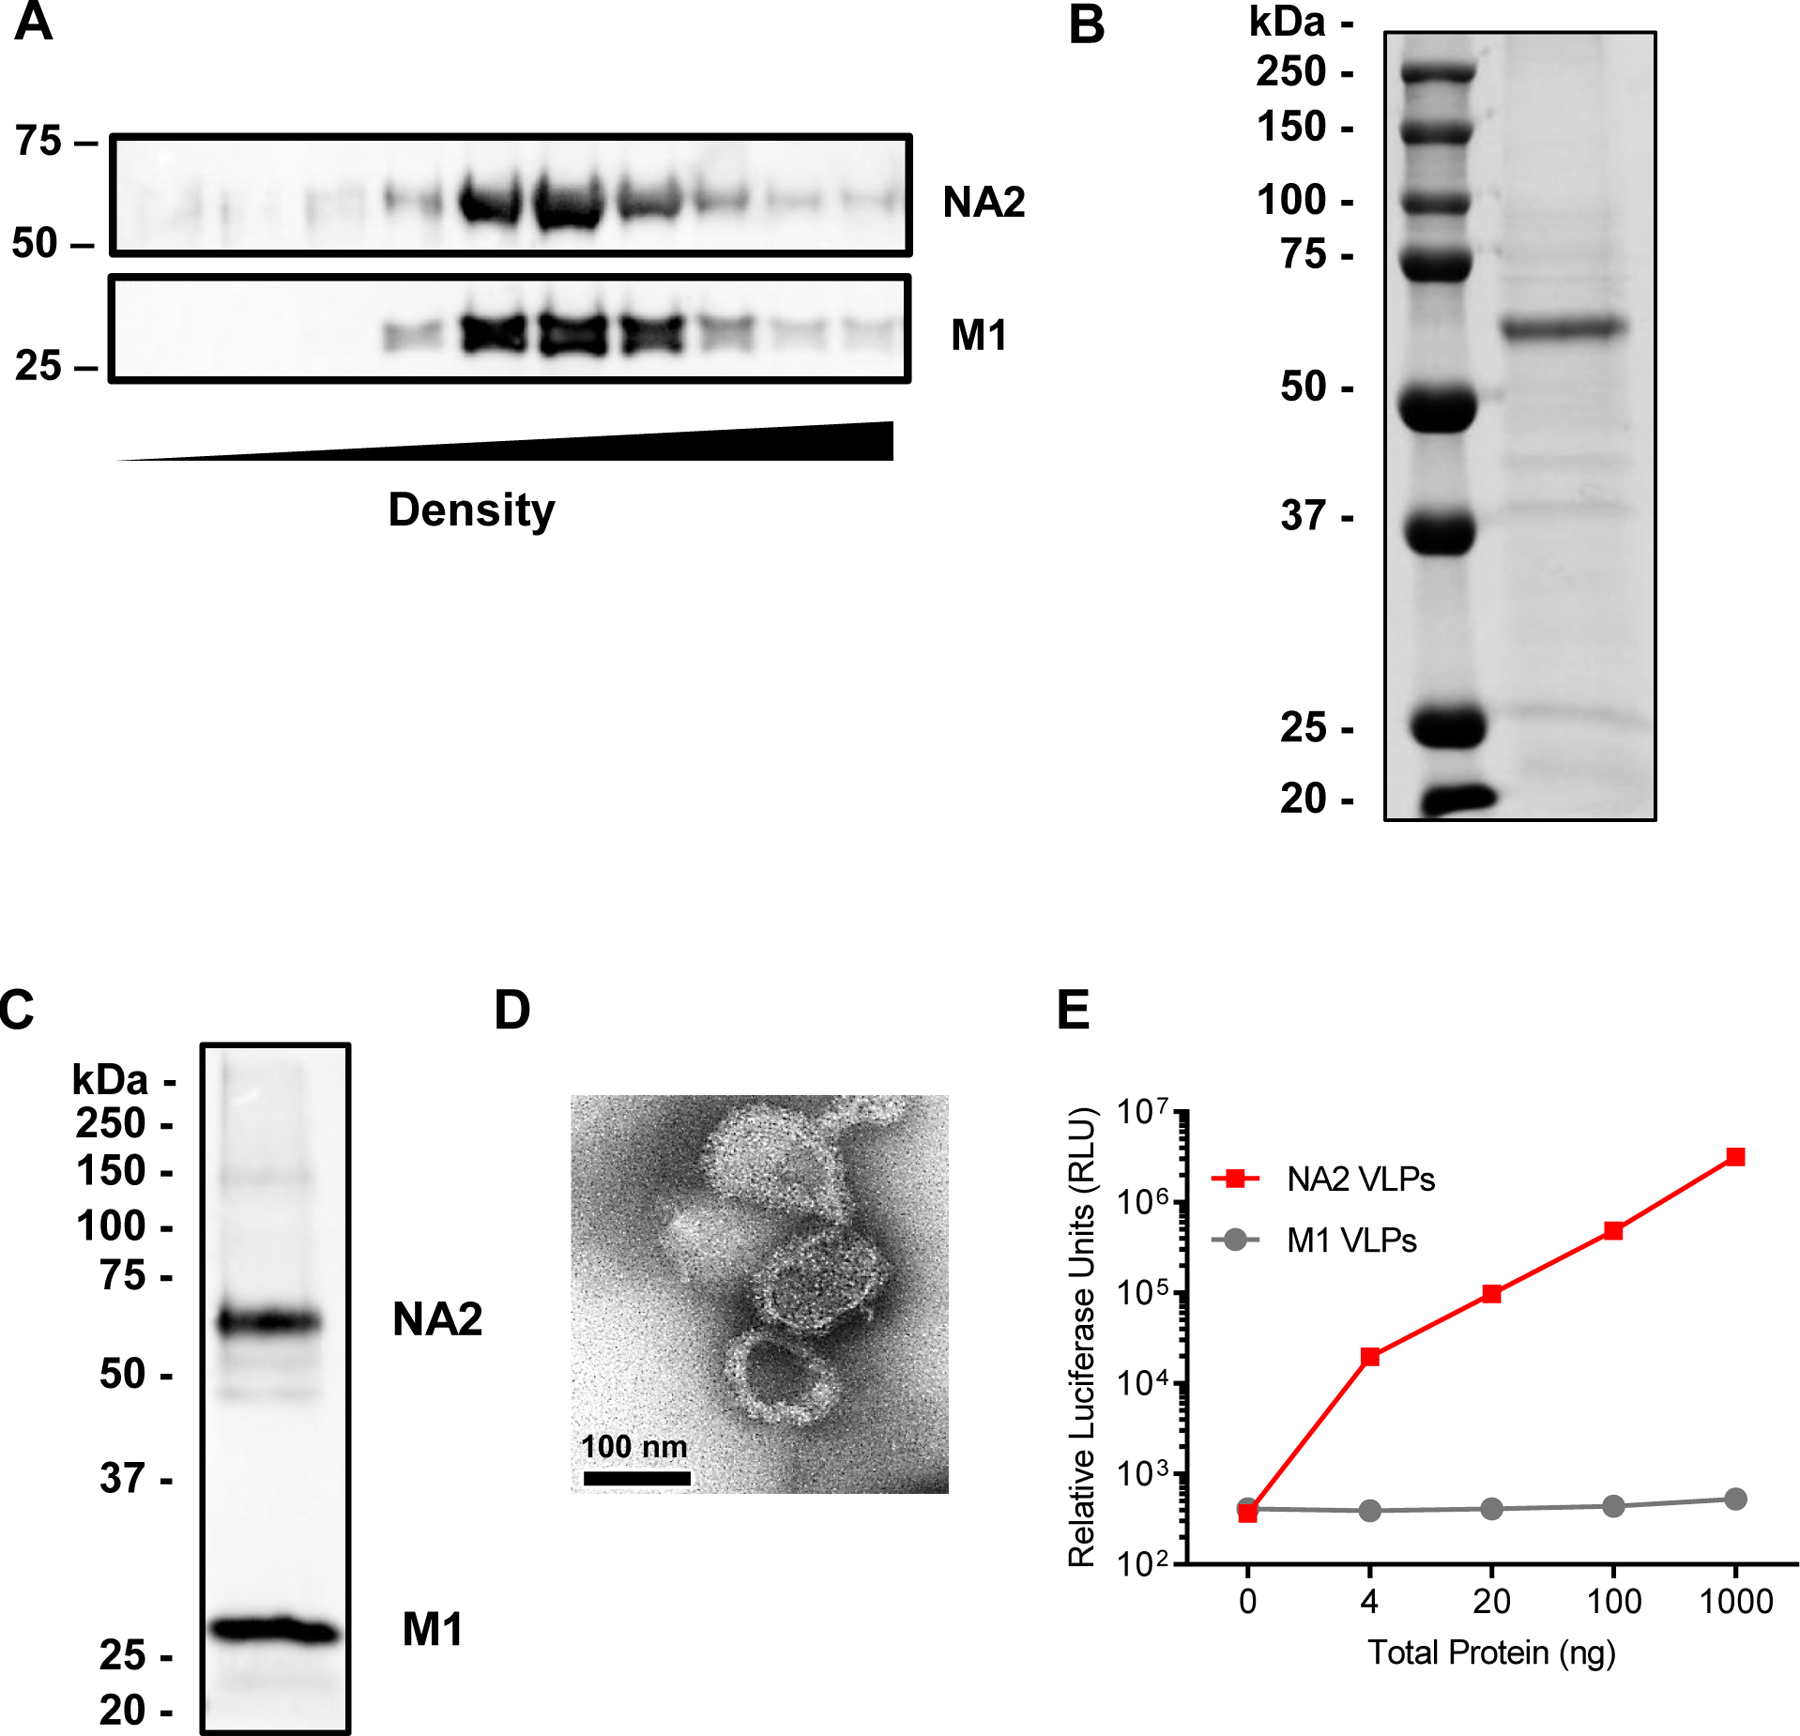
NA2 VLP purification and characterization. (A) Western blot analysis of the migration of NA2 VLPs in 20–60% sucrose gradients after ultracentrifugation. Lane 1 represents the fraction with the lowest density, lane 10 represents the fraction with the highest density. NA2 blots were probed with polyclonal goat anti-NA2 sera, while M1 blots were probed with polyclonal goat anti-M1 sera. (B) Coomassie stained SDS-PAGE gel loaded with 10 µg of NA2 VLP preparation. Molecular weight in kilodaltons (kDa) is indicated to the left. (C) Western blot of 10 µg of NA2 VLP preparation. Blot was probed with polyclonal goat anti-NA2 and anti-M1 sera. Molecular weight in kilodaltons (kDa) is indicated to the left. (D) Negative stain electron micrograph of NA2 VLP preparation. Scale bar represents 100 nm. (E) Neuraminidase activity by NA-STAR assay. The NA2 VLP preparation is indicated by the black line and symbols, while M1 only VLPs are indicated by the grey line and symbols. Individual symbols represent the mean of 3 replicates. Error bars represent the standard error of the mean (SEM).
