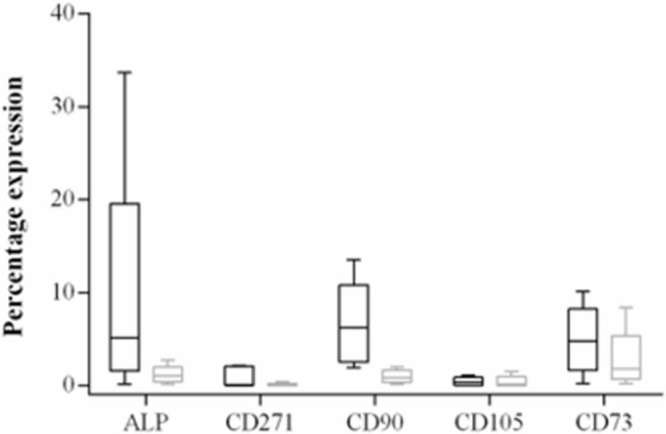
Fig. 1.

Box plot diagram showing percentage expression of CD271, CD90, CD105, CD73, and alkaline phosphatase (ALP) of primary isolates of acetabular (black box) and femoral neck (grey box) bone. Median, 25% and 75% quartiles, and maximum and minimum values are shown. An outlier for ALP is also demonstrated on the box plot.
