Fig. 3.

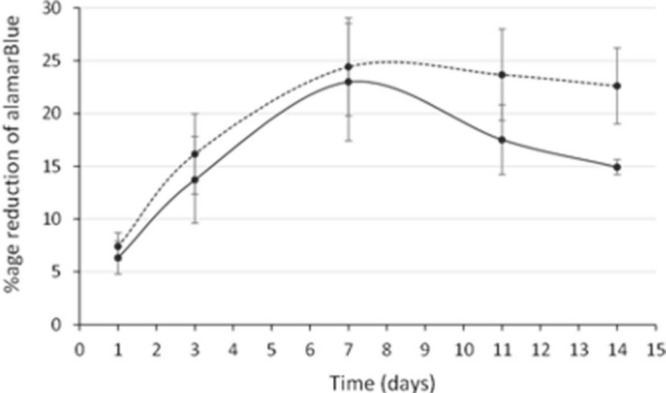
Change in the metabolic activity of human osteoblast cell cultures with time. Acetabular human osteoblasts are represented by the smooth line and neck cells by the dotted line. Each point shows the mean and standard error of the mean.

Change in the metabolic activity of human osteoblast cell cultures with time. Acetabular human osteoblasts are represented by the smooth line and neck cells by the dotted line. Each point shows the mean and standard error of the mean.