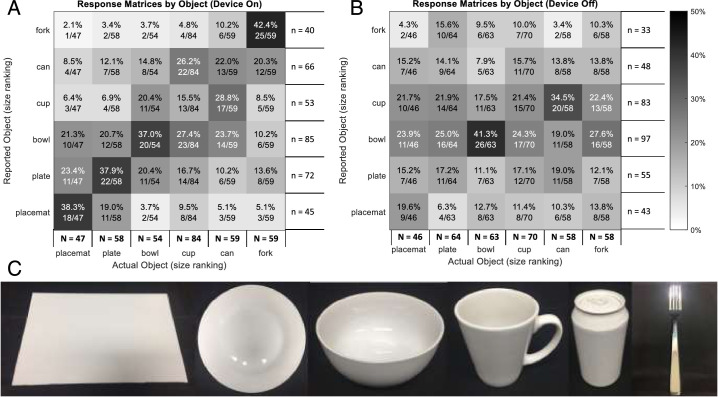
Figure 14.
Response matrices for tabletop object identification pooled from all time points. (A) Comparisons with device on for reported object versus actual object demonstrate low scores for object identification but also clustering of responses according to the size of the actual object. (B) Comparisons with device off for reported object versus actual object. Cell text indicates incidence percent and fraction of actual object incidence. Row numerator totals (n) are the response incidence. Column numerator totals (N) are the total object incidence. (C) Photos of the objects used for tabletop search (from left): placemat, plate, bowl, cup, can, and fork.

