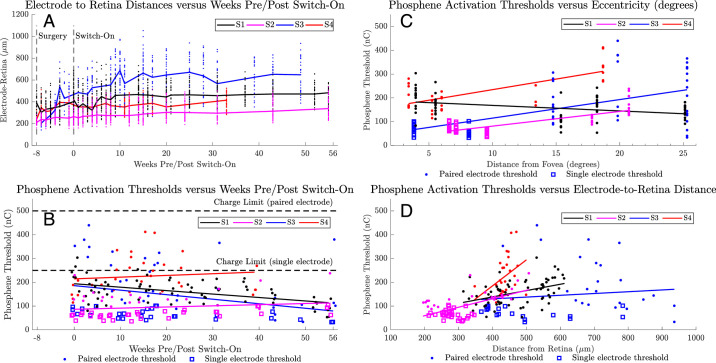
Figure 8.
(A) Electrode to retina distances obtained from OCT images. Each different color (black, magenta, blue, red) indicates data for each subject. Individual electrode measurements are shown as dots. A solid line connects the median values between time points. A vertical line at −8 weeks indicates the date of surgery. A vertical line at 0 weeks indicates the date of device activation (‘switch-on’). (B) Device thresholds for a subset of five phosphenes per subject were assessed throughout the 56-week period. Phosphenes are typically in a single electrode configuration (open squares) for electrodes nearest the fovea and paired electrode configuration (solid dots) for electrodes at the periphery where higher charge requirements have been observed. Defined safe charge limits of 250 nC (single electrode) and 500 nC (paired electrode) are indicated with dotted horizontal lines. A solid line describes a linear regression for each subject. (C) Device thresholds for the same subset of five phosphenes per subject versus eccentricity from the fovea (degrees). A SOLID LINE describes a linear regression for each subject. (D) Device thresholds for the same subset of five phosphenes per subject versus electrode-to-retina distance (in micrometers). A solid line describes a linear regression for each subject.

