Figure 1.

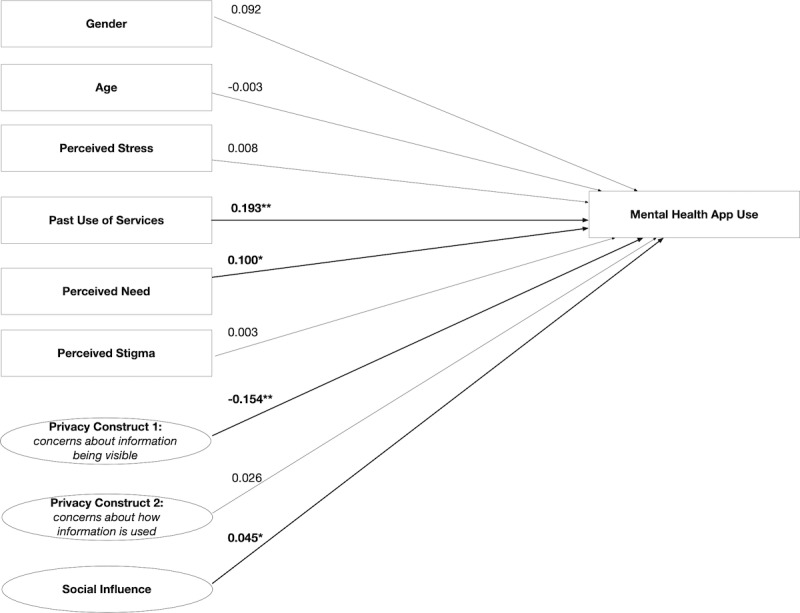
Direct effect model showing the path coefficients and levels of significance for relationships among variables. *Relationship is significant at P<.05; **relationship is significant at P<.01; n=449.

Direct effect model showing the path coefficients and levels of significance for relationships among variables. *Relationship is significant at P<.05; **relationship is significant at P<.01; n=449.