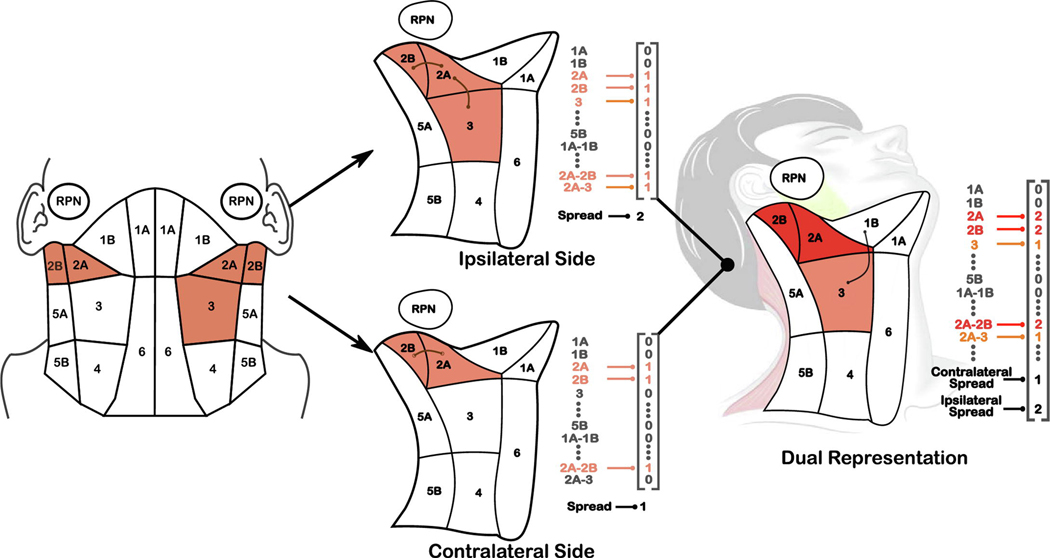
Figure 1.
(Left) Diagram of the anatomically-adjacent representation of affected lymph nodes, for an example patient with levels 2A-2B affected on both sides of the head and level 3 affected on the ipsilateral side of the head. Adjacent regions are represented as bigrams (e.g., 2A-2B) in our encoding (Appendix A). (Center) Encodings for each side of the head. The contralateral side is given a ‘maximum spread’ value of 2 to represent the travel distance from 2b to 3, while the contralateral side (opposite primary tumor) has a spread of 1 for 2A-2B. (Right) Composite encoding for the patient that captures symmetry of the head and neck; diseased regions are added while the maximum LN spread on each side are treated as two separate covariates.

