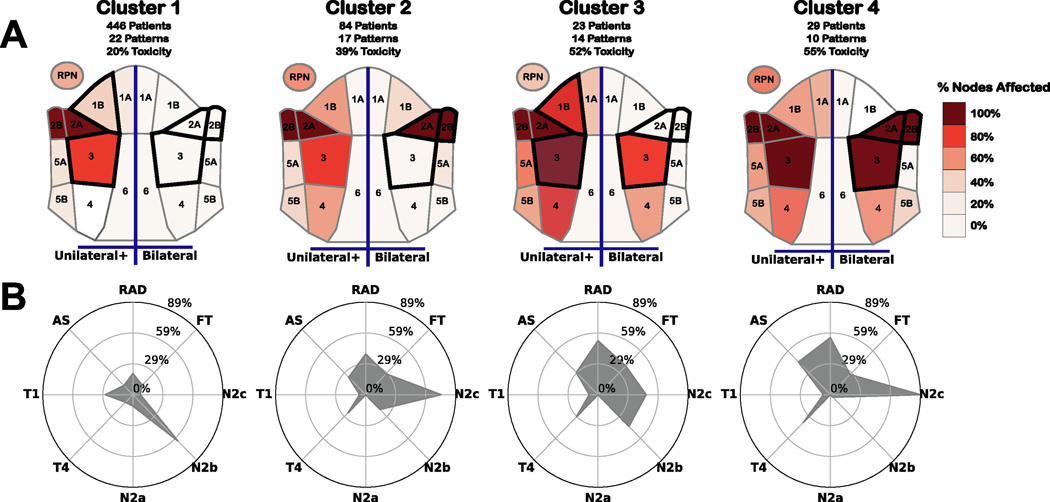
Figure 2:
Visual representation of each cluster. (A) Heat map of nodal spread within each cluster. Left half of each map indicates % of patients in the cluster with at least one affected node on a specific level, while the right half encodes the percentage of patients with bilateral spread within a specific level. Regions outlined in black denote regions that are most discriminative for cluster membership, and could be used to determine if 99% of patients are within a given cluster. (B) Radar chart showing the % of patients in each cluster with a given toxicity or inclusion in a specific clinical staging category. FT: Feeding Tube, AS: Aspiration, RAD: Radiation-associated dysphagia, T1–2: T-category 1 or 2, T3-T4: T-category 3 or 4, N0-N1: N-category 0 or 1, N2a-N2b: N-category 2a or 2b, N2c-N3: N-category 2c or 3.

