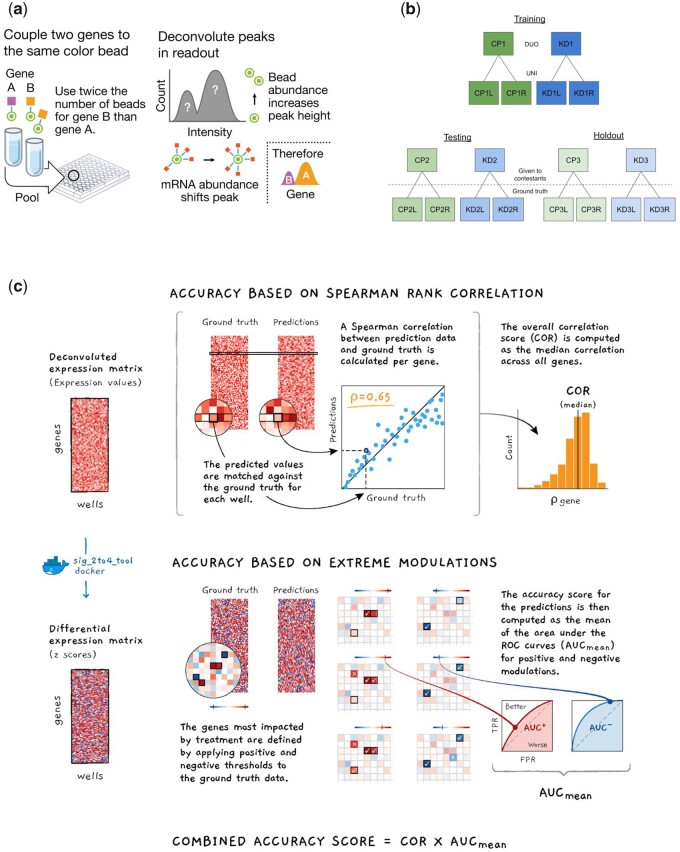
Fig. 1.
(a) Schematic of the deconvolution procedure, (b) overview of the data generated for the contest grouped into three pairs with six plates each: two perturbation types (compounds and shRNA) times three detection plates (two for UNI and 1 for DUO), and (c) illustration of the scoring methods for the evaluation of submissions

