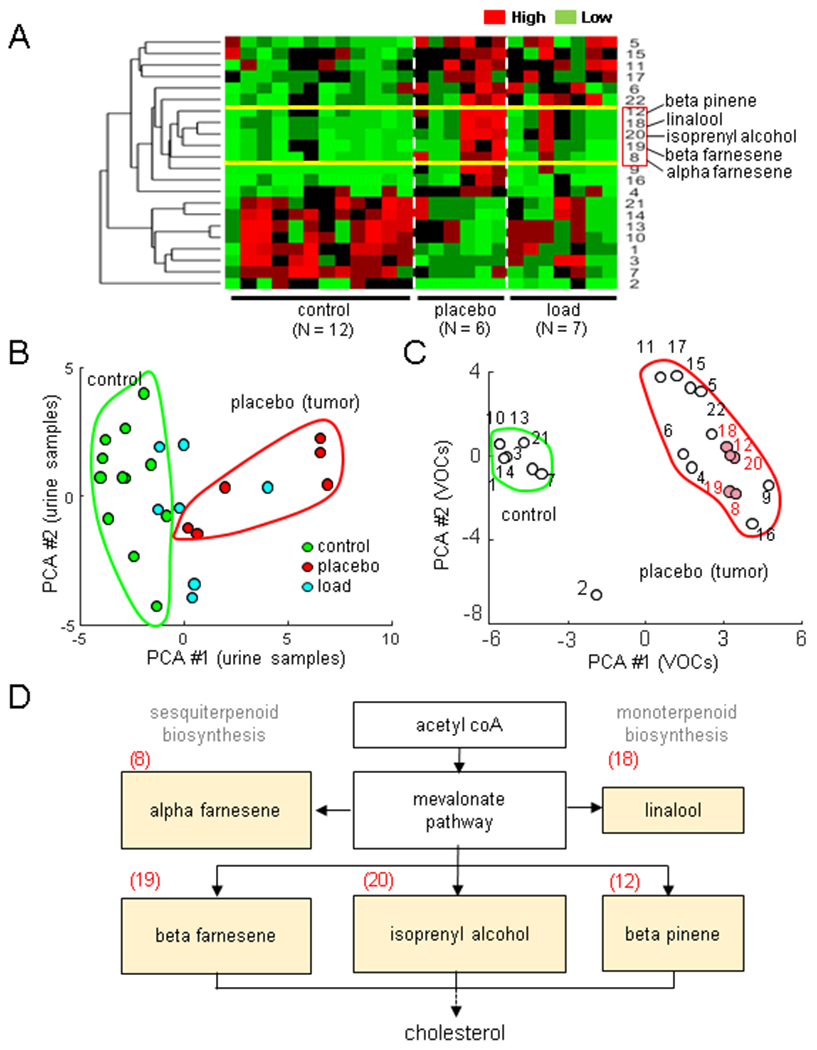
Figure 3.

Load-driven alterations in urinary volatile organic compounds (VOCs). Of note, PCA = principal component axis. The single and double asterisks indicate p < 0.05 and p < 0.01, respectively. (A) Hierarchical clustergram for the normal, placebo, and loaded groups, including 22 VOCs. (B&C) Principal component plots for the urine samples and 22 VOCs, respectively. (D) Mevalonate pathway leading to cholesterol synthesis including 5 VOCs (alpha/beta-farnesene, linalool, isoprenul alcohol, and beta-pinene) that were enriched in the placebo group.
