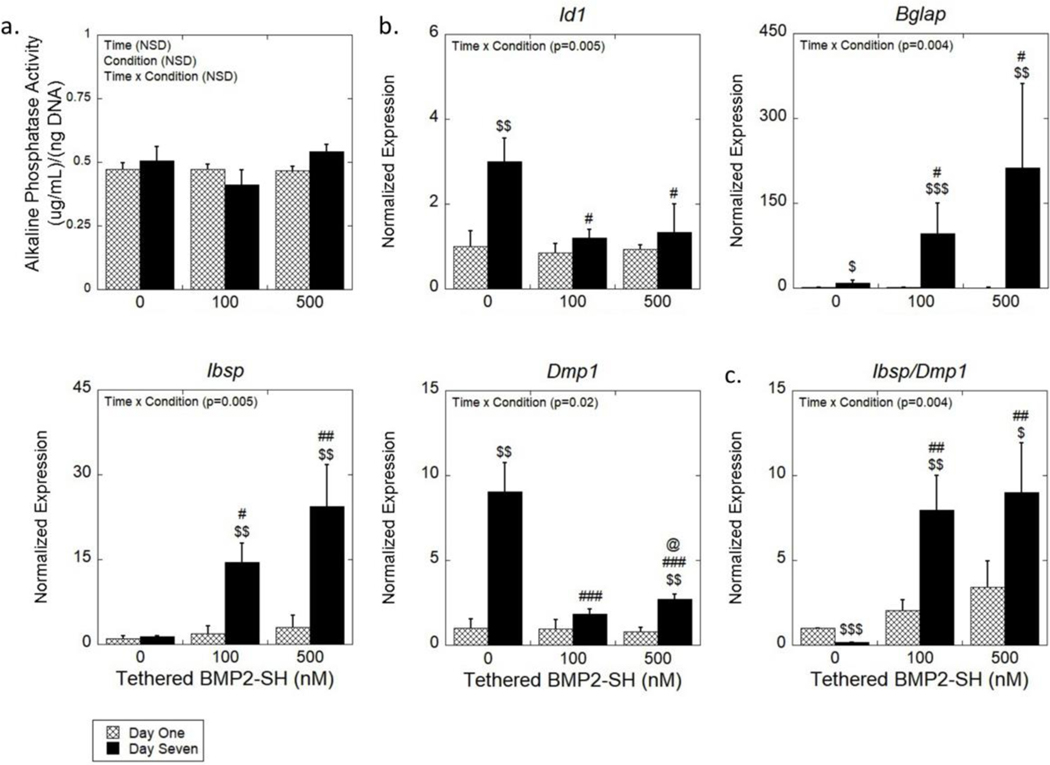
Figure 5.
(a) The ALP activity normalized to DNA content as a function of time. Data are represented as the mean with standard deviation error bars (n = 3). (b) Expression of osteogenic genes (Id1, Bglap, Ibsp, Dmp1) of encapsulated MC3T3-E1 cells normalized to gene expression of no BMP-2 condition at day one. (c) A ratio of the gene expression of Ibsp and Dmp1 of encapsulated MC3T3-E1. Data represented as the mean with standard deviation error bars (n = 3). Data were analyzed by two-way ANOVA. Statistical significance determined by student’s t-test within a condition between days indicated by $. Statistical significance on the same day as determined by one-way ANOVA indicated by # for those relative to the no BMP-2 condition and by @ for those relative to the 100 nM condition. One symbol indicates p < 0.05, two symbols indicate p < 0.01, and three symbols indicate p < 0.0001. NSD = Not statistically different.

