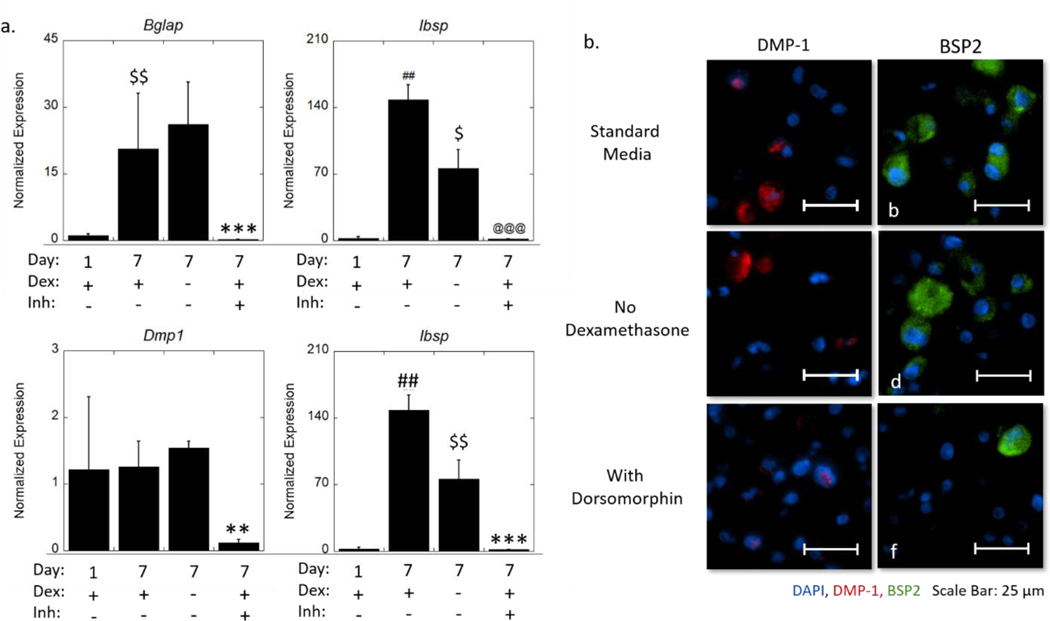
Figure 7.
(a) Expression of osteogenic genes (Id1, Bglap, Dmp1) normalized to gene expression of no BMP-2 in standard medium at day one and a ratio of expression of Ibsp and Dmp1 of encapsulated MC3T3-E1 cells. Data are represented as the mean with standard deviation error bars (n=3). (b) Representative widefield fluorescent microscopy images for DMP-1 (red) and BSP2 (green) at day seven cultured in standard medium (a-b), medium without dexamethasone (c-d), and medium with dorsomorphin (e-f). Nuclei are counterstained blue. Scale bar = 25 μm. Data were analyzed by student’s t-test. Statistical significance between day seven standard media and day one indicated by #. Statistical difference between day seven no dexamethasone and day seven standard media indicated by $. Statistical significance between day seven with dorsomorphin and day seven standard media indicated by *. One symbol indicates p < 0.05, two symbols indicate p < 0.01, and three symbols indicate p < 0.001.

