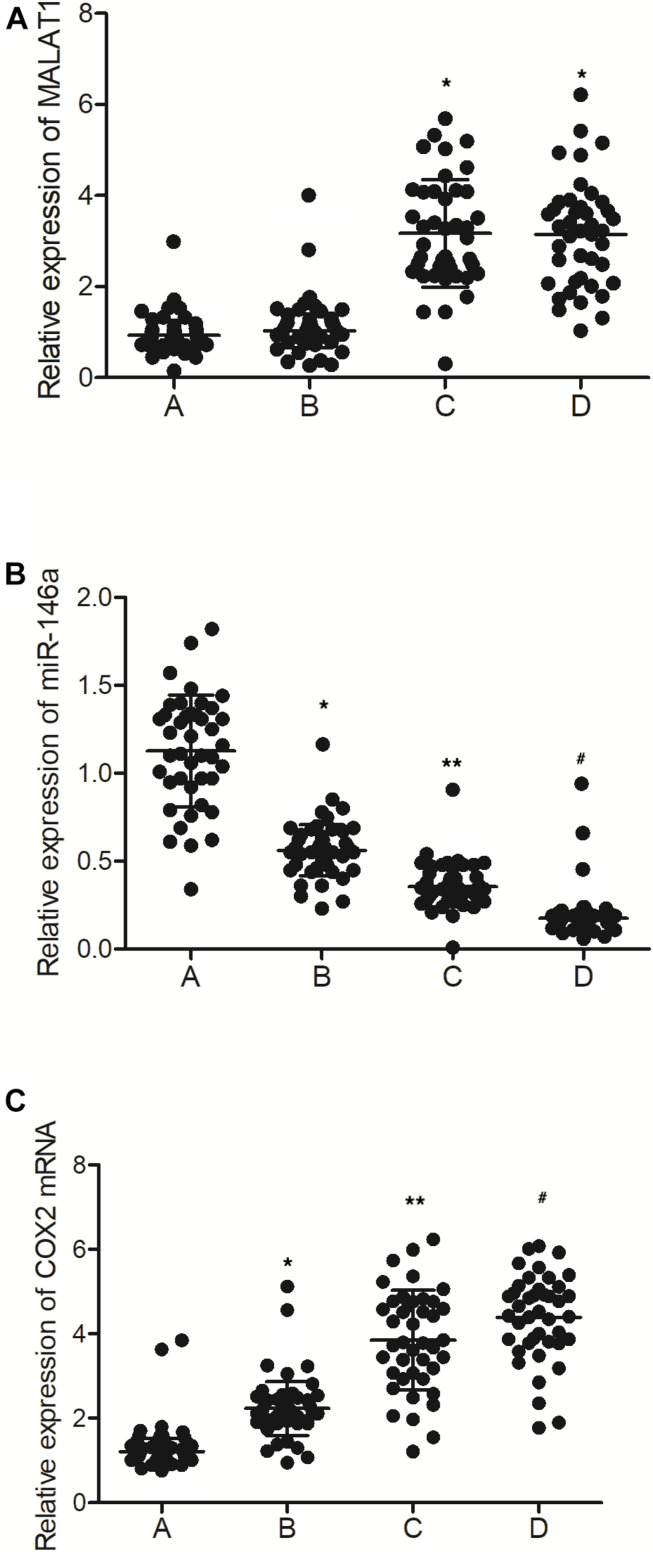
FIGURE 2.
The levels of MALAT1, miR-146a, and COX2 mRNA in PBMC samples were different among different groups (A: MALAT1 HYPER + miR-146a HYPO group; B: MALAT1 HYPER + miR-146a HYPER group; C: MALAT1 HYPO + miR-146a HYPO group; D: MALAT1 HYPO + miR-146a HYPER group. *p < 0.05 vs. group A; **p < 0.05 vs. group B; #p < 0.05 vs. group C). (A) Relative expression of MALAT1 in the PBMC samples was similar between MALAT1 the HYPER + miR-146a HYPO group and the MALAT1 HYPER + miR-146a HYPER group, while being lower than that of the MALAT1 HYPO + miR-146a HYPO group and the MALAT1 HYPO + miR-146a HYPER group. (B) Relative expression of miR-146a in the PBMC samples gradually decreased following the order of MALAT1 HYPER + miR-146a HYPO group, MALAT1 HYPER + miR-146a HYPER group, MALAT1 HYPO + miR-146a HYPO group, and MALAT1 HYPO + miR-146a HYPER group. (C) Relative expression of COX2 mRNA in the PBMC samples gradually increased following the order of MALAT1 HYPER + miR-146a HYPO group, MALAT1 HYPER + miR-146a HYPER group, MALAT1 HYPO + miR-146a HYPO group, and MALAT1 HYPO + miR-146a HYPER group.

