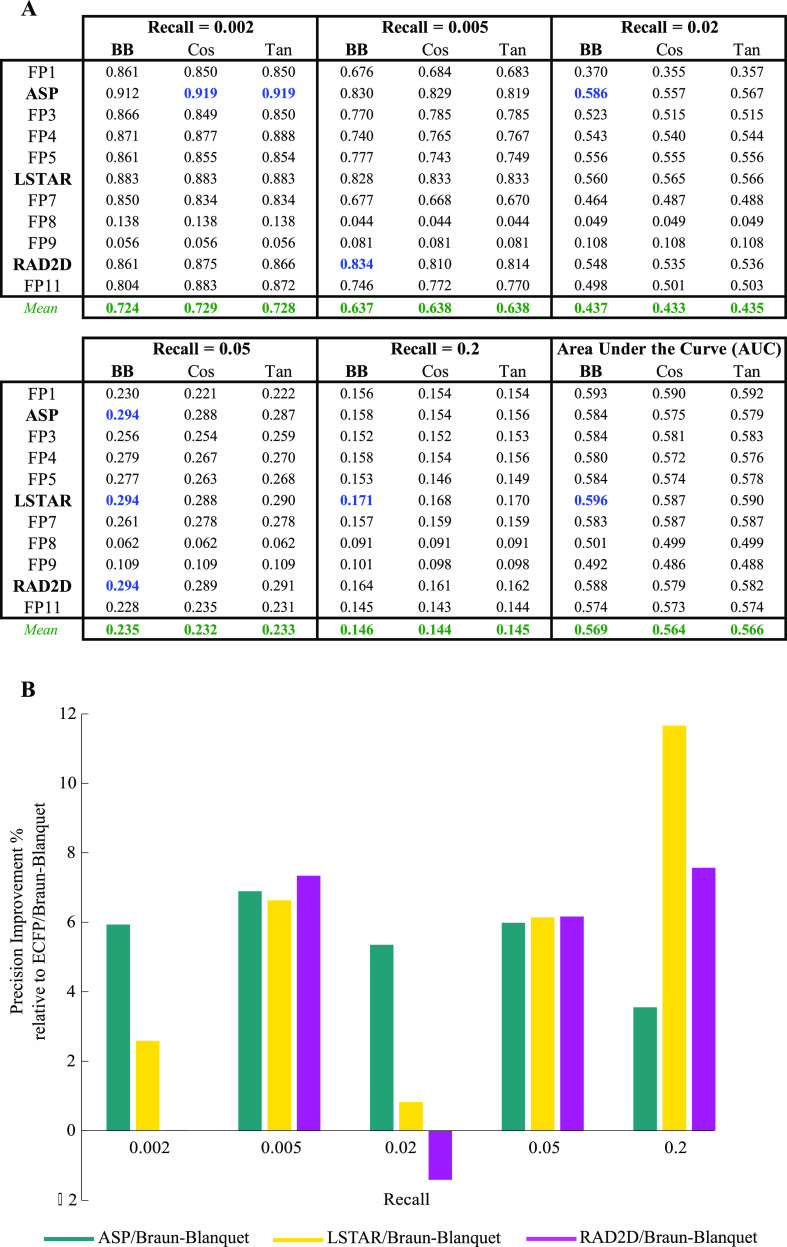
Figure 2.
Performance of selected prediction models using our RIKEN high-confidence set (Table S1 for the complete evaluation of all prediction models). (A) Precision at several recall thresholds and the area under the ROC curve for each model, where a molecular fingerprint was paired with the Braun-Blanquet, Cosine, or Tanimoto similarity coefficient, evaluated based on chemical–genetic similarity as the gold standard for biological activity. The blue values represent the highest precision achieved at a given recall, and the green values represent the average precision over all molecular fingerprints for a similarity coefficient at a specific recall threshold. (B) Relative performance of ASP, LSTAR, and RAD2D fingerprints to that of ECFP. For all the molecular fingerprints that required a depth of description, precision was measured at a depth of 8. With the exception of ASP, LSTAR, and RAD2D, the remaining molecular fingerprints are coded as FP1–FP11 (Table 1).

