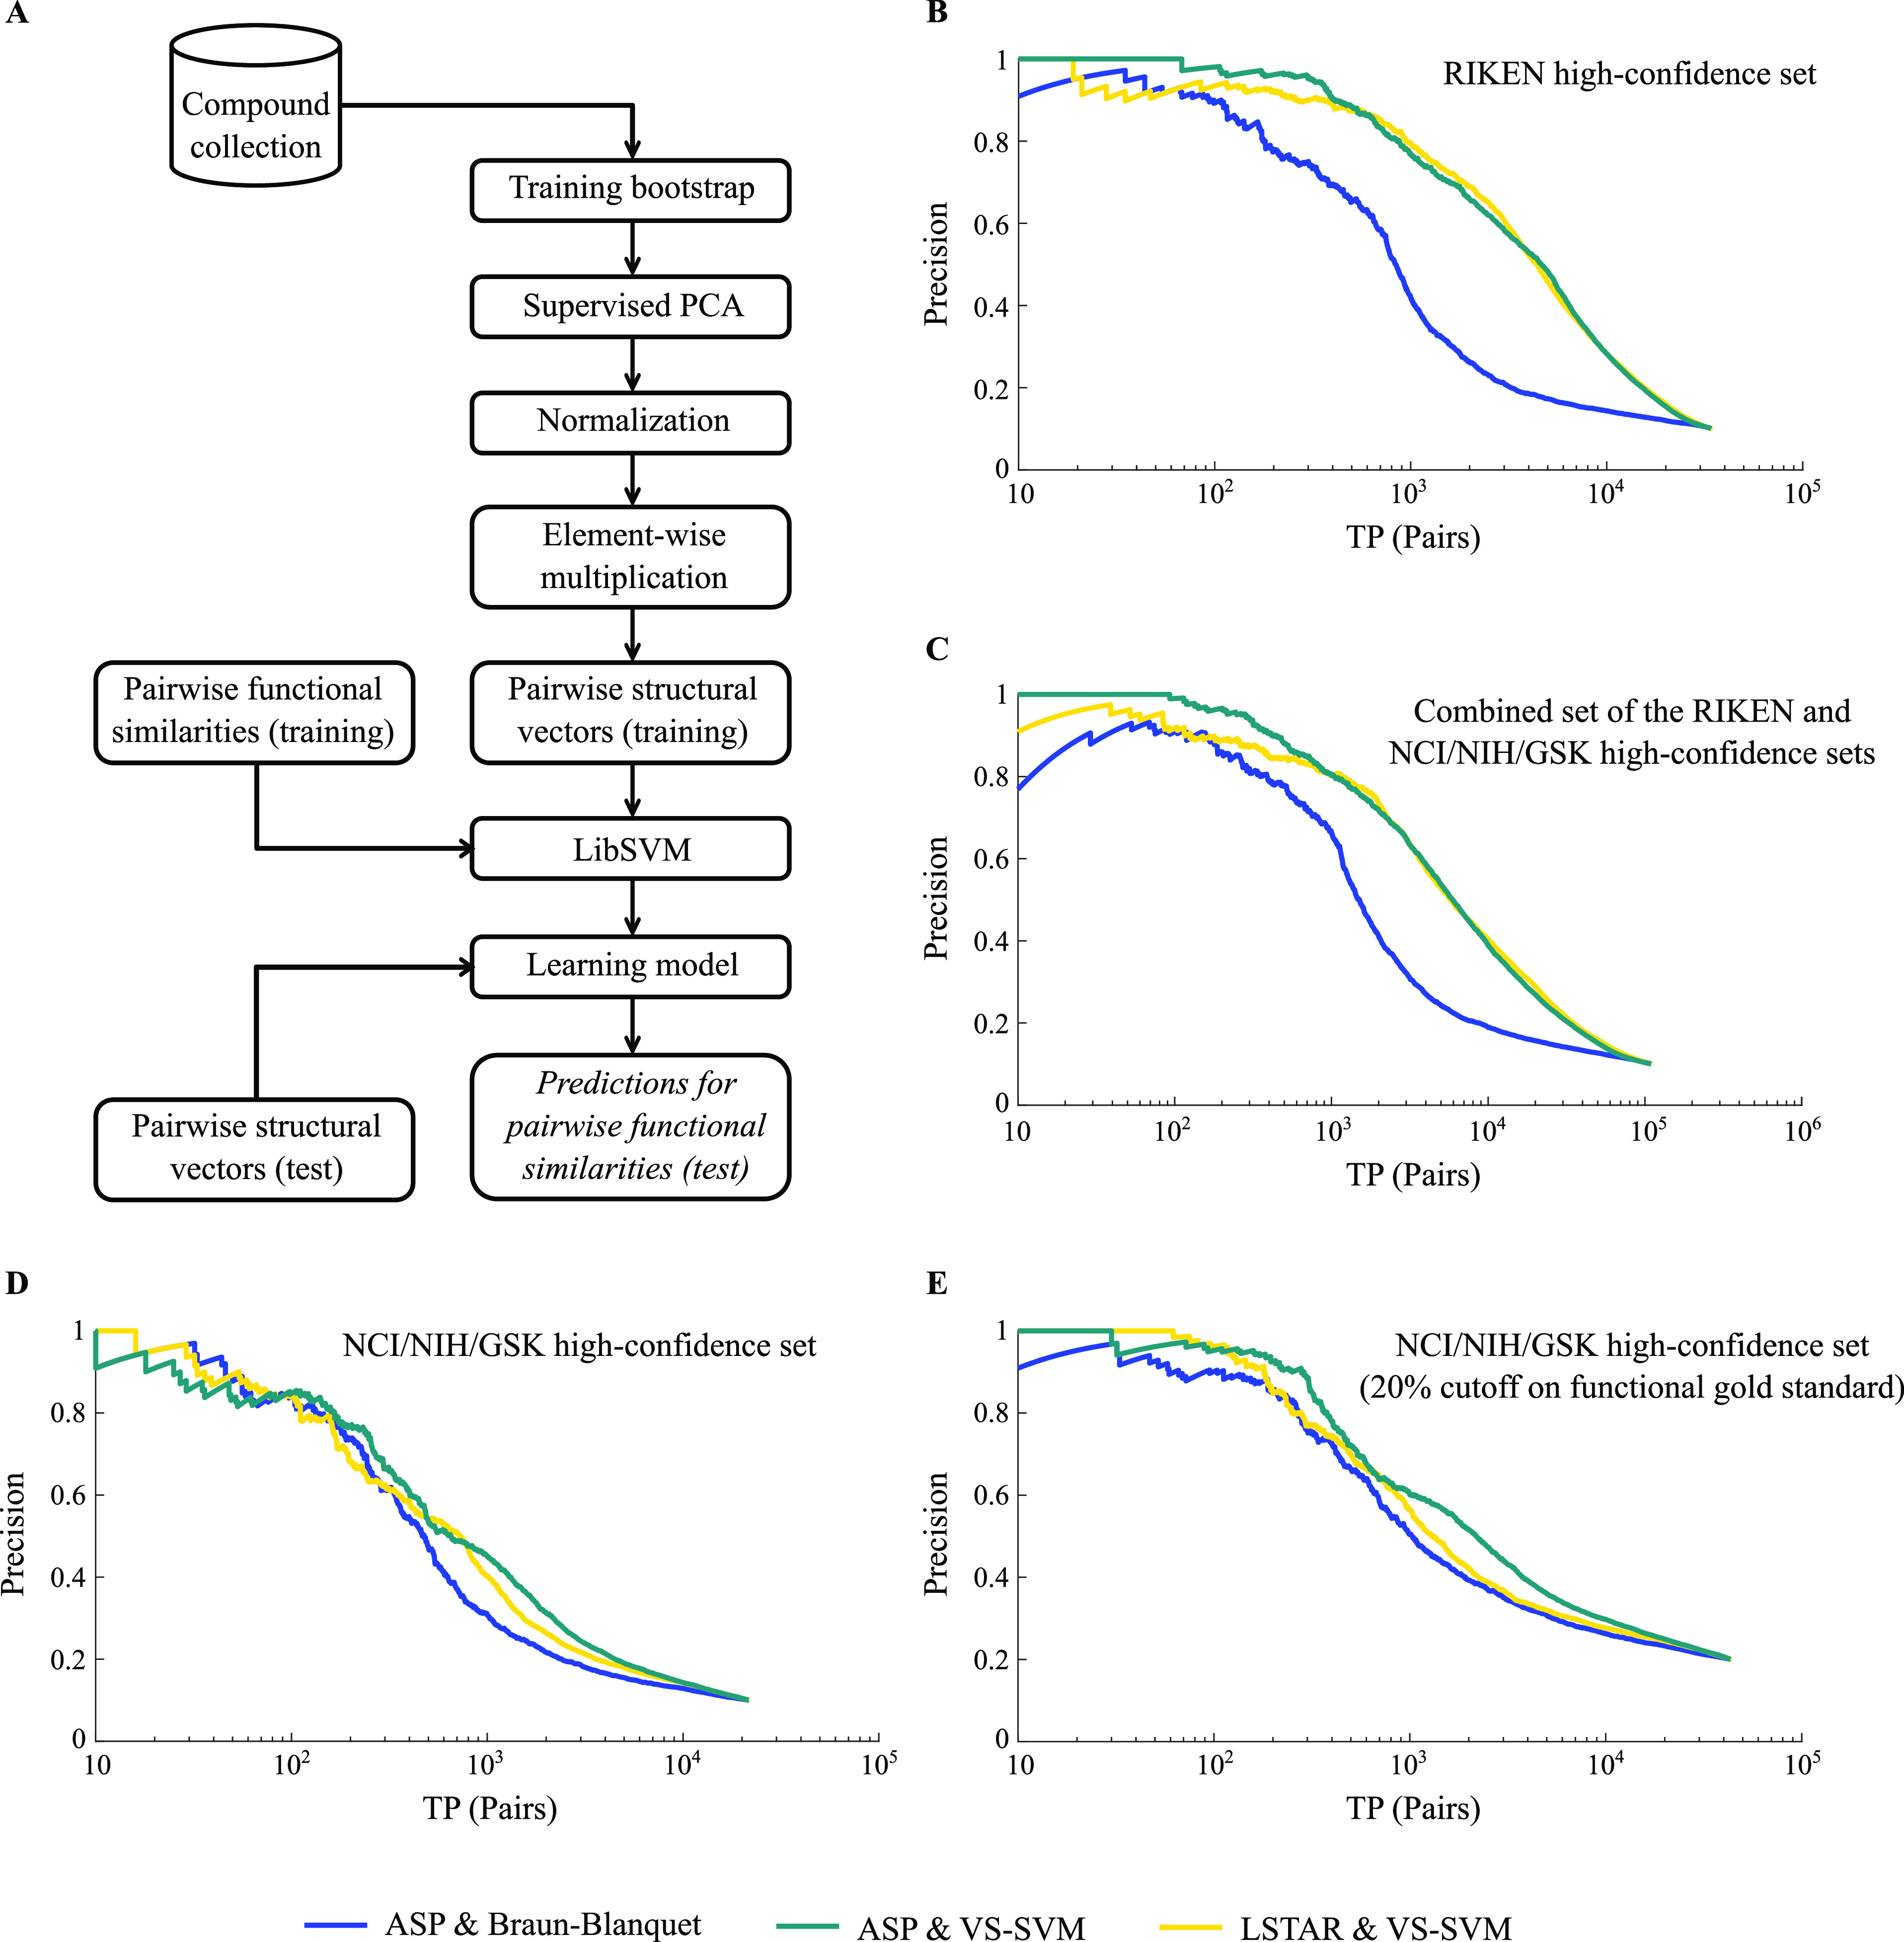
Figure 5.

Prediction performance of machine learning models. (A) Learning pipeline for one bootstrap using pairwise structural vectors (Materials and Methods). (B) Model performance for our RIKEN high-confidence set. The blue precision–recall (PR) curve represents the prediction performance of our best structural similarity measure (ASP/Braun-Blanquet), whereas the teal and gold PR curves represent the performance of our machine learning models using ASP and LSTAR fingerprints, respectively. A prediction is considered a true positive if the compound pair is within the top 10% of functionally similar compound pairs using chemical–genetic interaction profiles. We used pairwise true positives or TP (pairs) as a general form of recall in our PR curves. (C) Model performance for the combined RIKEN and NCI/NIH/GSK high-confidence sets. (D) Model performance for the NCI/NIH/GSK high-confidence set. (E) Model performance for the NCI/NIH/GSK high-confidence set (as in panel (D)), except using top 20% of pairwise chemical–genetic similarities to define true positives.
