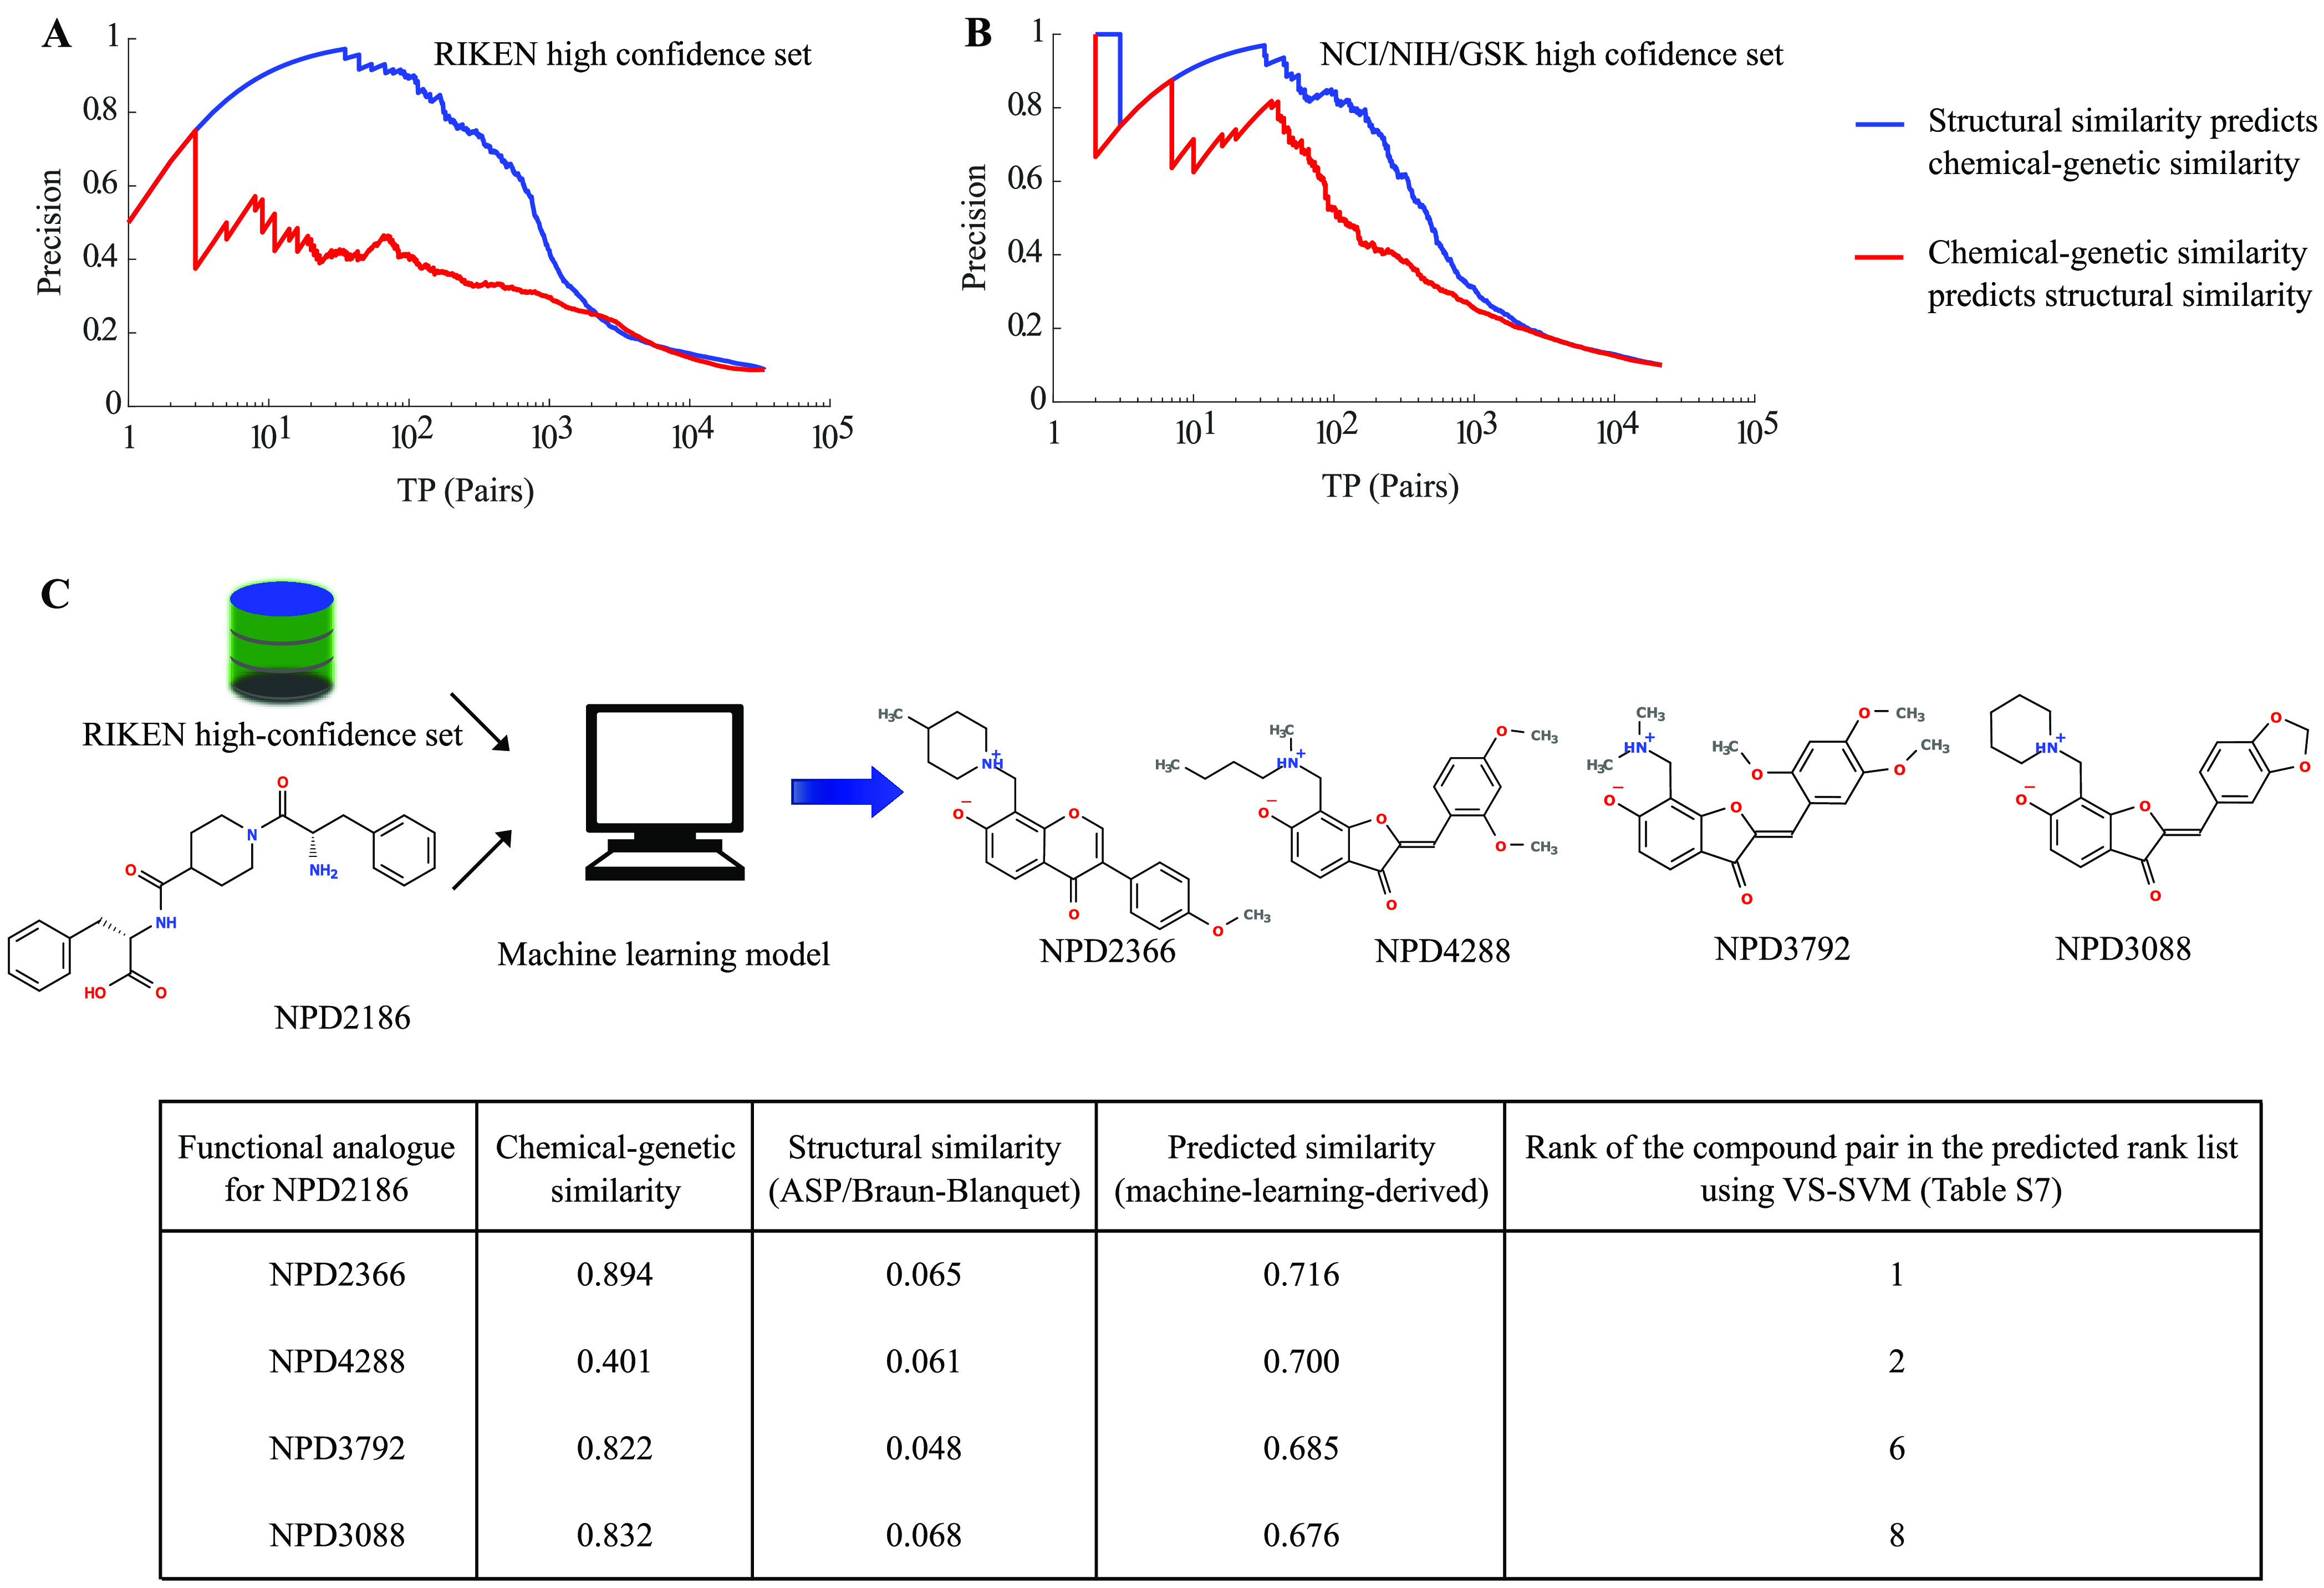
Figure 8.

Reciprocal evaluation of the prediction performance of structural vs functional similarity and machine learning-based virtual screening of a target (e.g., NPD2186 from the RIKEN high-confidence set). Using (A) RIKEN and (B) NCI/NIH/GSK high-confidence sets, we measured the abilities of structural and chemical–genetic similarities to reciprocally predict each other. The blue curve represents the performance of structural similarity in predicting chemical–genetic similarity, whereas the red curve represents the performance of chemical–genetic similarity in predicting structural similarity. (C) Our machine learning model retrieved biologically similar but structurally dissimilar compounds (determined by the ASP/Braun-Blanquet structural similarity measure) for NPD2186 from our RIKEN high-confidence set. The information table provides the chemical–genetic similarities, ASP/Braun-Blanquet structural similarities, and machine learning-derived predicted similarities for a few of the compounds at the top of the predicted ranked list that are functionally analogous to NPD2186. The highest predictive score generated by our machine learning model was 0.716, retrieving NPD2366 as a functional analogue of NPD2186. The rank of each compound pair comes from the table of all pairwise compound similarities ranked in descending order of predicted machine learning-derived similarities (Table S7).
