
Figure 2:
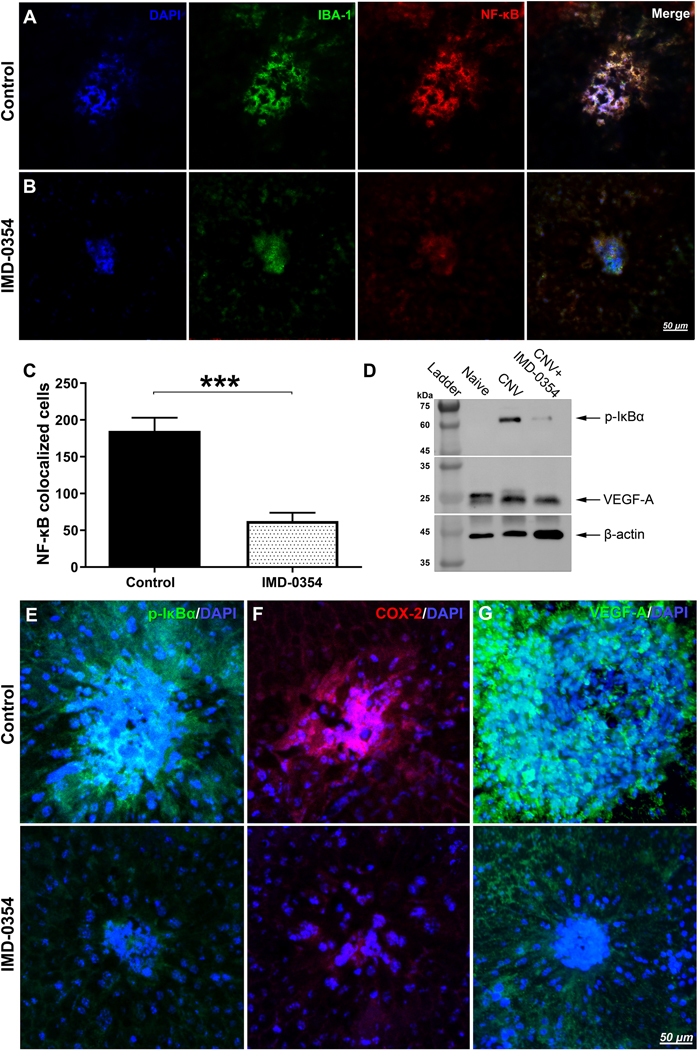
Immunofluorescent evaluation of NF-κB activation and NF-κB downstream signaling protein expression within the laser spots with and without IKK2 Inhibition in RCSC flat mounts.
Effect of IKK2 Inhibition on the presence of IBA-1 positive microglial cells (green) with NF-κB (red) nuclear (blue) translocation within the laser spot in mouse RCSC 5 days after laser CNV induction. The vesicle-treated controls (A) and eyes were treated with subconjunctival IMD-0354 (10 μg) (B). Quantitative analysis of NF-κB colocalized cells. Representative images of NF-κB/DAPI double staining and colocalization are present in Fig. S1A-B. (C). Statistical significance was determined using Student’s t-test. ***p < 0.001. n=6 (6 eyes, 18 CNV spots) (D) Western blot analysis of p-IκBα and VEGF-A in RCSC lysates of Naïve controls, laser CNV control, and IMD-0354 treated animals. β-actin was used as the loading control. Full-length blots are presented in Fig. S2. Immunofluorescence evaluation of p-IκBα (E), COX-2 (F), VEGF-A (G) within laser spots in mouse RCSC with and without IKK2 inhibition 5 days after laser CNV induction.