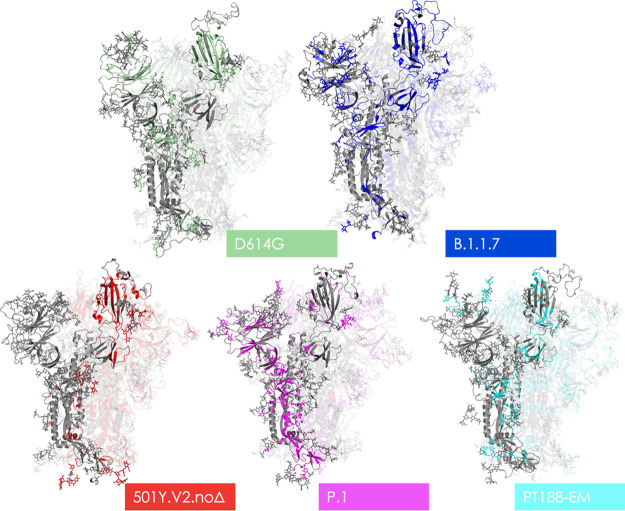
Figure 4.
Structural representations of epitopes on different variants. The various structures depicted show the 3D structure of protomer A in gray. Residues rendered in the color assigned to their respective variant in Figure 2 mark the locations of all predicted epitopes; areas in gray represent non-immunogenic regions. Glycan heavy atoms are rendered as sticks.

