
Table 2. Epitope Predictions on Each Variant and Epitope Conservation Ratioa.
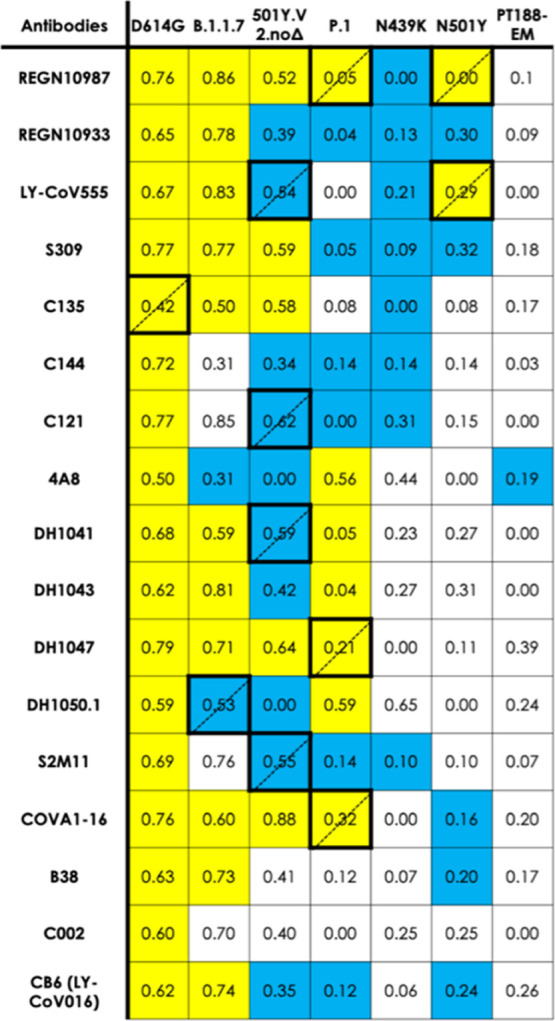
Each cell reports an epitope conservation ratio for each S variant–Ab combination, relating in silico predictions to experimental epitopes from experimental Cryo-EM and/or crystal structures. Conservation ratios lower than 0.5 indicate epitope loss; otherwise an epitope is considered to be conserved. Each cell in the table is color-coded according to the experimentally measured activity of the corresponding Ab on the respective variant. If the Ab remains active, the cell is yellow. If the Ab has lost activity against that variant, the cell is blue. If experimental data is unavailable for a particular Ab on a particular variant, the cell is white. Disagreement between predictions and experiment (i.e., blue and conservation ratio >0.5 or yellow and conservation ratio <0.5) is indicated by thick borders and dotted-line diagonal.