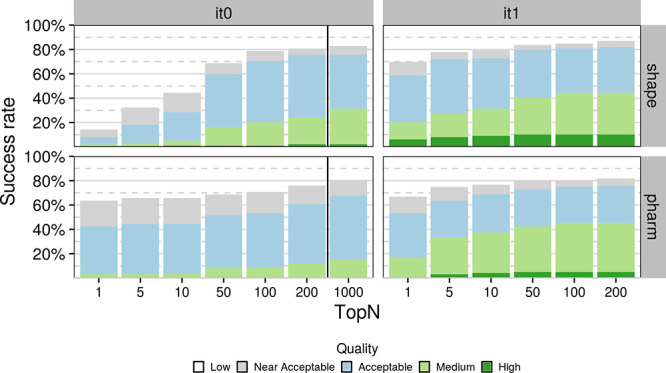
Figure 2.

Success rate as a function of N-ranked models considered based on the HADDOCK score (top N) for tops 1, 5, 10, 50, 100, 200, and 1000 models for the initial rigid-body docking (it0) and after flexible refinement (it1). Each stacked bar plot corresponds to a specific cutoff with the color of the bar indicating the distribution of model quality for that cutoff. Dark green, light green, light blue, and light grey correspond to high-, medium-, acceptable-, and near-acceptable-quality models, respectively. The respective RMSD cutoffs are ≤0.5, ≤1, ≤2, and ≤2.5 Å when considering all heavy atoms of the compound after superimposing on the binding site backbone atoms of the receptors. Results have been grouped by protocol on the y axis and stage on the x axis. The black vertical line in the “it0” indicates the cutoff at which models proceed to flexible refinement.
