
Figure 2.
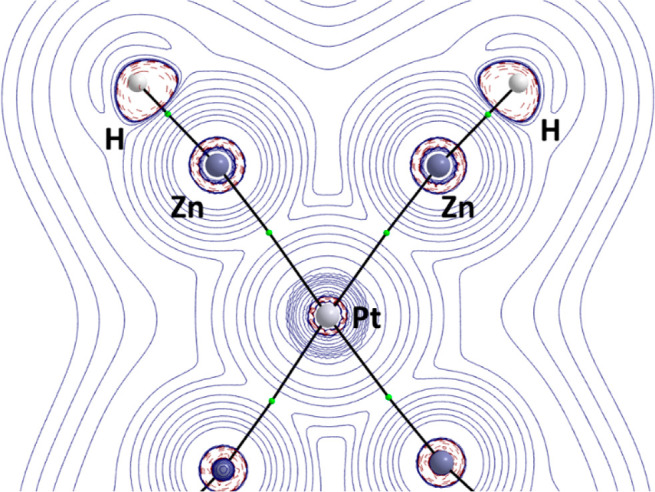
Contour line diagrams ∇2ρ(r) for Pt(ZnH)6 in the Zn–Pt–Zn plane. The solid lines connecting the atomic nuclei are the bond paths, while the small green spheres indicate the corresponding bond critical points.
Official websites use .gov
A
.gov website belongs to an official
government organization in the United States.
Secure .gov websites use HTTPS
A lock (
) or https:// means you've safely
connected to the .gov website. Share sensitive
information only on official, secure websites.
Contour line diagrams ∇2ρ(r) for Pt(ZnH)6 in the Zn–Pt–Zn plane. The solid lines connecting the atomic nuclei are the bond paths, while the small green spheres indicate the corresponding bond critical points.