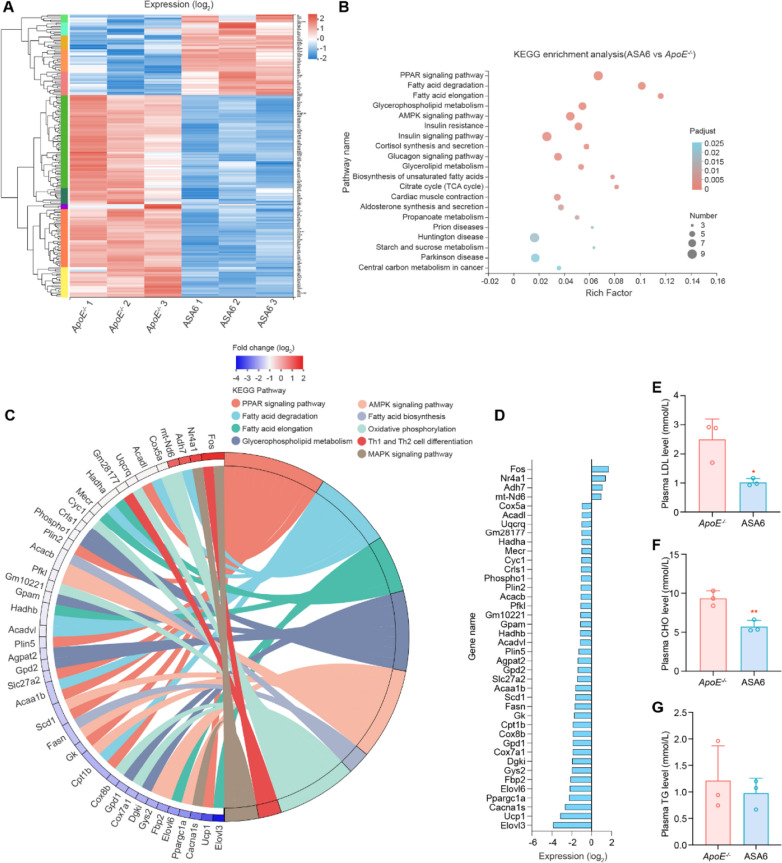
Fig. 7.
Therapeutic mechanisms of ASA6 on atherosclerosis. A Heat map of significantly up regulated and down regulated genes in aorta after ASA6 treatment (fold change ≥ 2 and P < 0.05). B KEGG pathway enrichment analysis of differentially expressed genes. The top 20 enriched pathways are shown. C Circos Plots of KEGG enrichment in lipid metabolism and macrophage polarization pathway related genes. D Relative expression levels of differentially expressed transcripts in aorta related to lipid metabolism and macrophage polarization pathway (data from A). E-G Plasma LDL, CHO and TG levels in ApoE−/− control and ASA6 treated groups. Data represent means ± s.d. from three independent replicates. *P < 0.05, **P < 0.01, Student’s t test (E–G)

