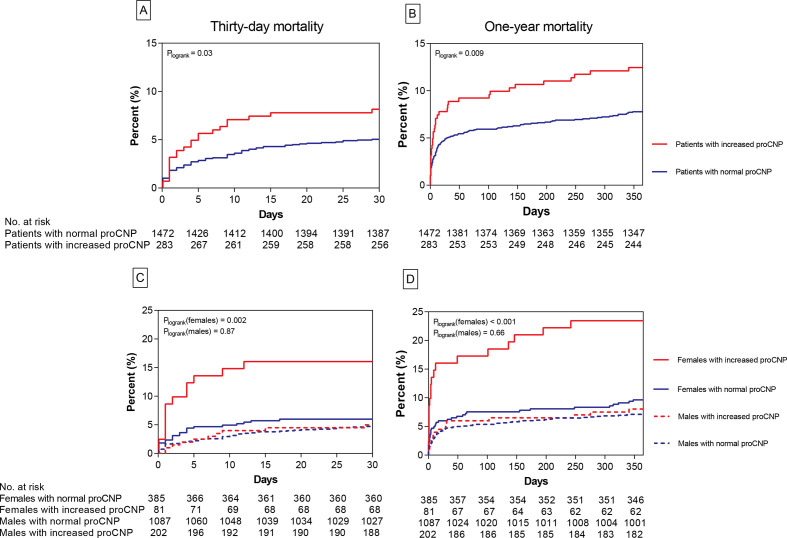
Figure 2.
Mortality rates for increased and normal pro-CNP in all patients and stratified by sex. Display of all-cause mortality rates for groups of normal versus increased pro-CNP concentrations in plasma. Graphs of 30-day and 1-year mortality rate for all patients are shown in A and B, respectively. Sex-specific 30-day and 1-year mortality rates are shown in C and D, respectively. The numbers of patients at risk in subgroups are given beneath each graph. CNP, C-type natriuretic peptide.

