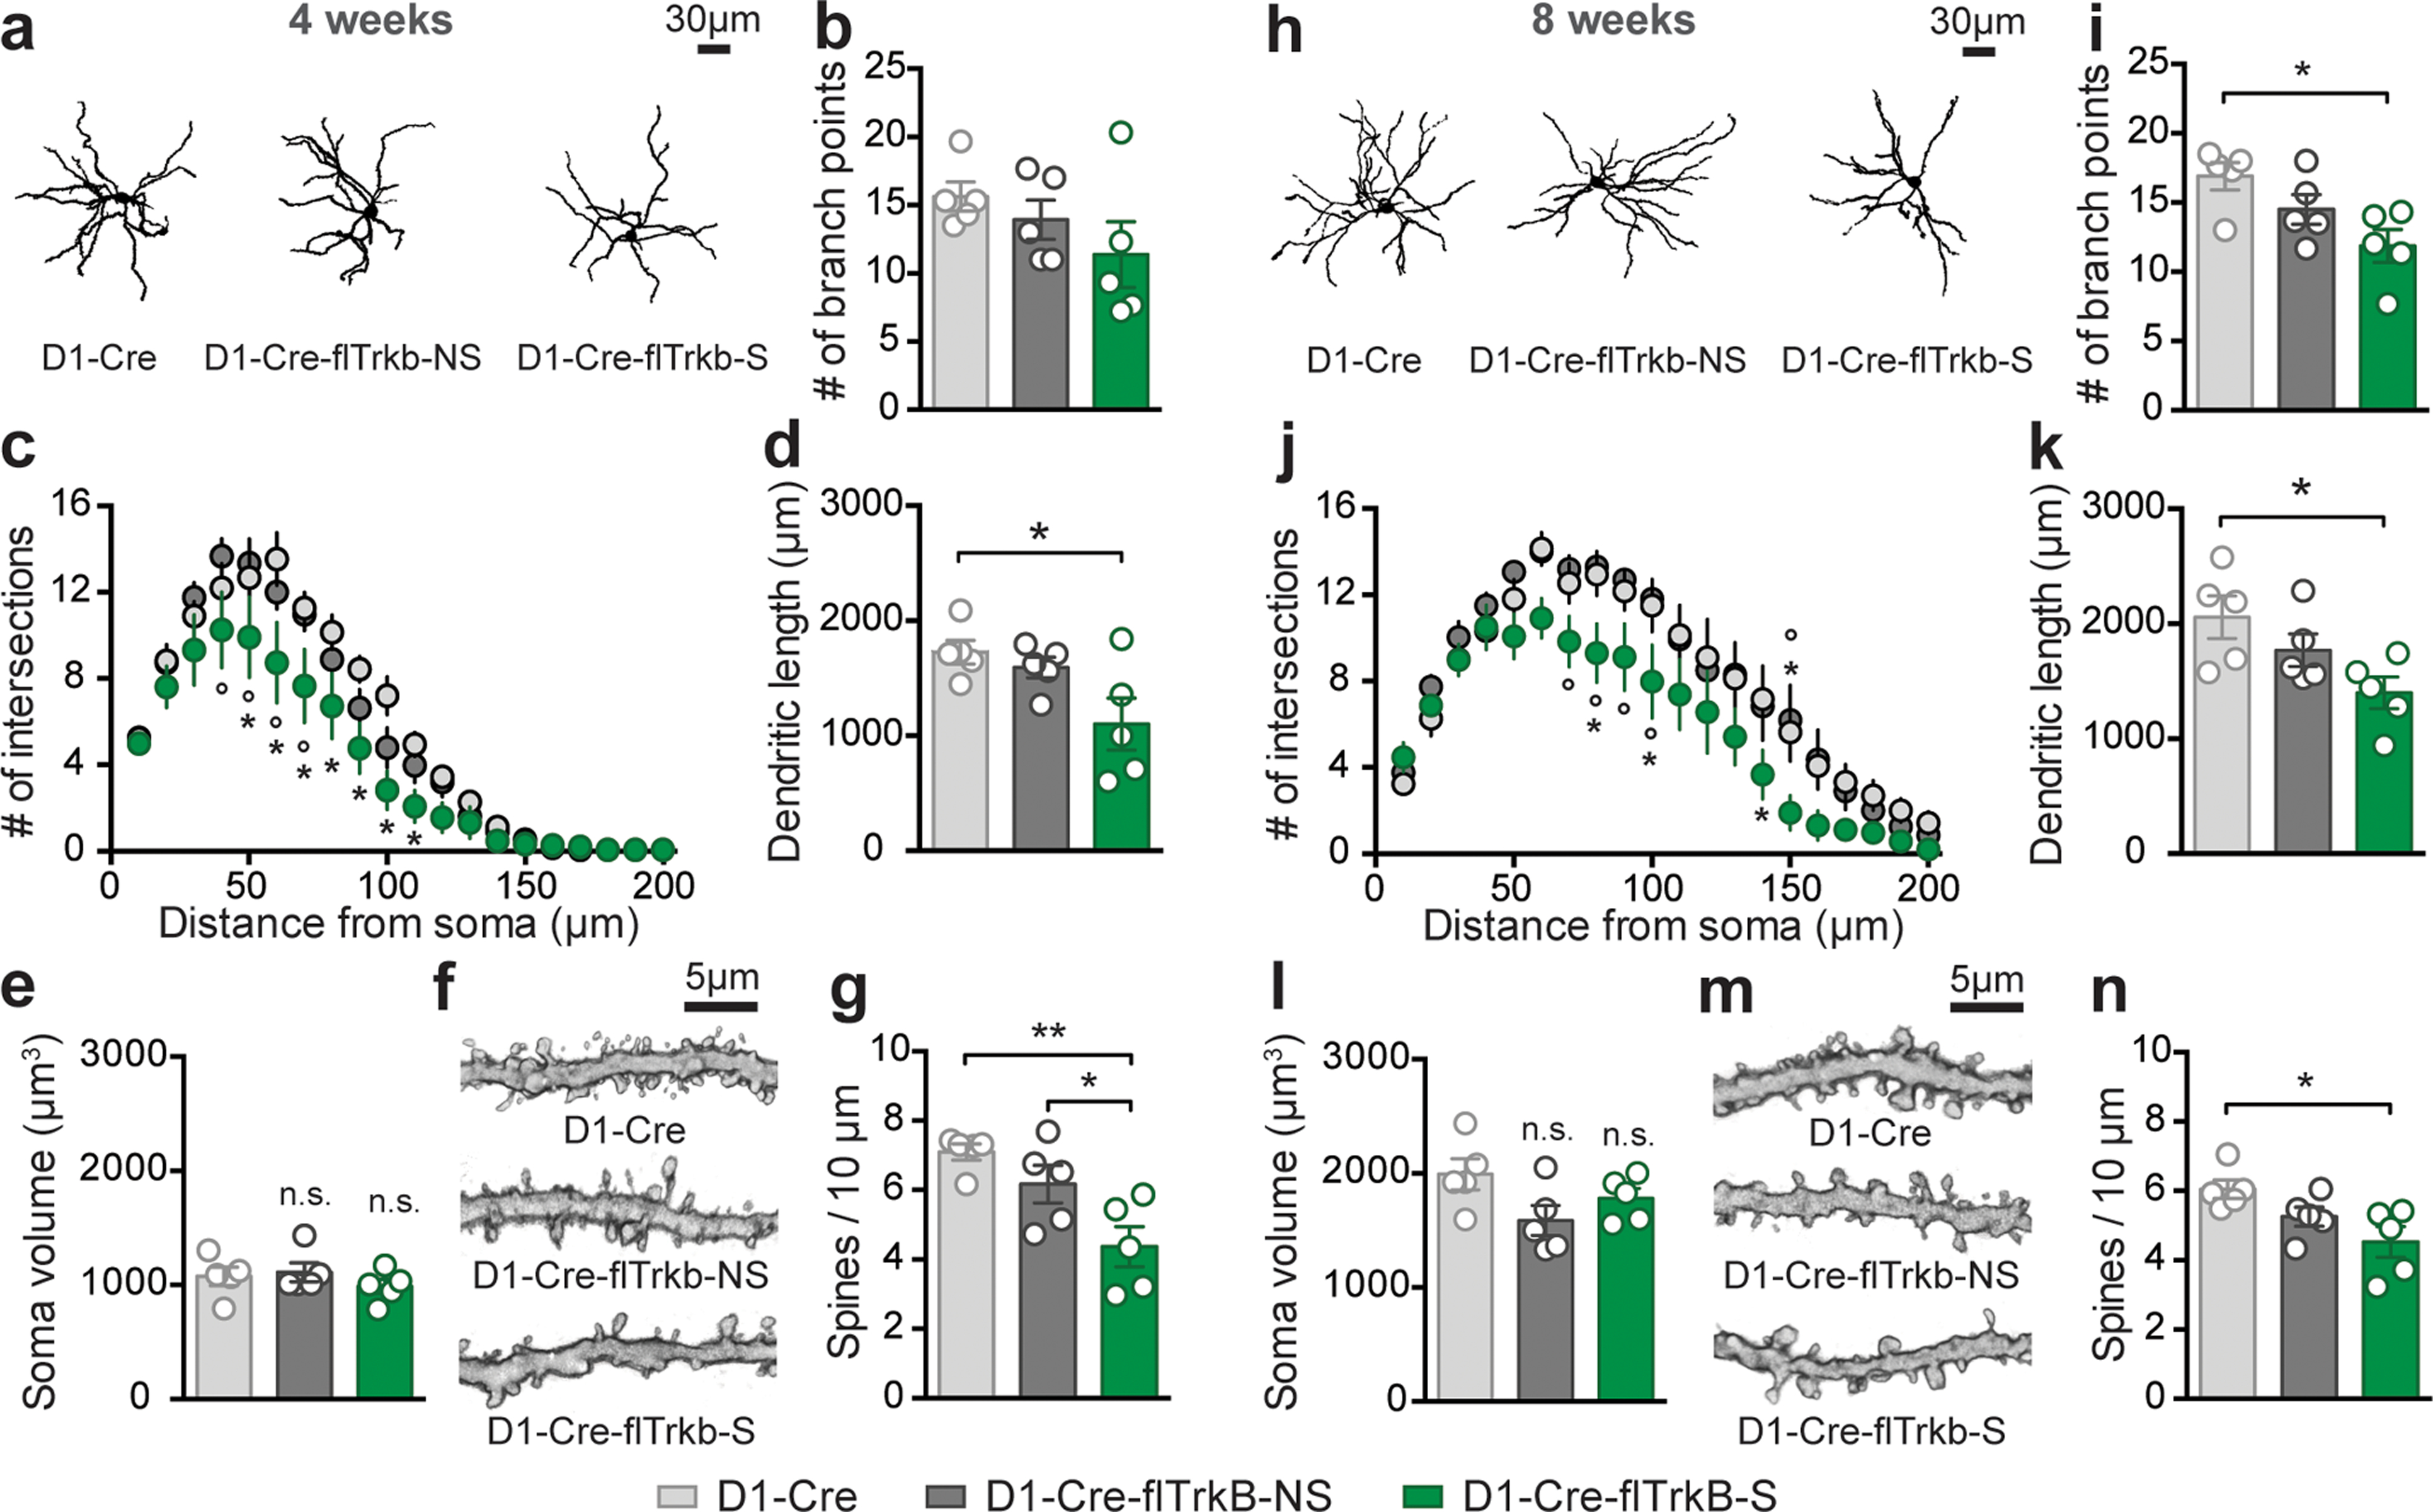
Figure 5:

Mice with stereotypy display D1-MSN dendritic atrophy and reduced dendritic spines at both 4 and 8 weeks: a. Representative images of dorsal striatum D1-MSN from each group at 4 weeks; b. Number of branch points is not significantly changed at 4 weeks; c. Decreased neuronal complexity (Sholl analysis, *p<0.05 from D1-Cre and °p<0.05 from D1-Cre-flTrkB-NS); d. Dendritic length is reduced in D1-Cre-flTrkB-RT-S mice (*p<0.05); e. Soma volume is unchanged in both D1-Cre-flTrkB-NS and D1-Cre-flTrkB-S mice; f. Representative images of D1-MSN dendritic spines from each group at 4 weeks; g. Decreased spine density in D1-Cre-flTrkB-S mice (*p≤0.05). h. Representative images of dorsal striatum D1-MSN from each group at 8 weeks; i. Number of branch points is significantly reduced in Cre-flTrkB-RT-S mice (*p<0.05); j. Decreased neuronal complexity (Sholl analysis, *p<0.05 from D1-Cre and °p<0.05 from D1-Cre-flTrkB-NS); k. Dendritic length is reduced in D1-Cre-flTrkB-RT-S mice (*p<0.05); l. Soma volume is unchanged in both D1-Cre-flTrkB-NS and D1-Cre-flTrkB-S mice; m. Representative images of D1-MSN dendritic spines from each group at 8 weeks; n. Decreased spine density in D1-Cre-flTrkB-S mice (*p≤0.05). For all graphs, n= 5 mice/group, 3–4 cells/mouse.
