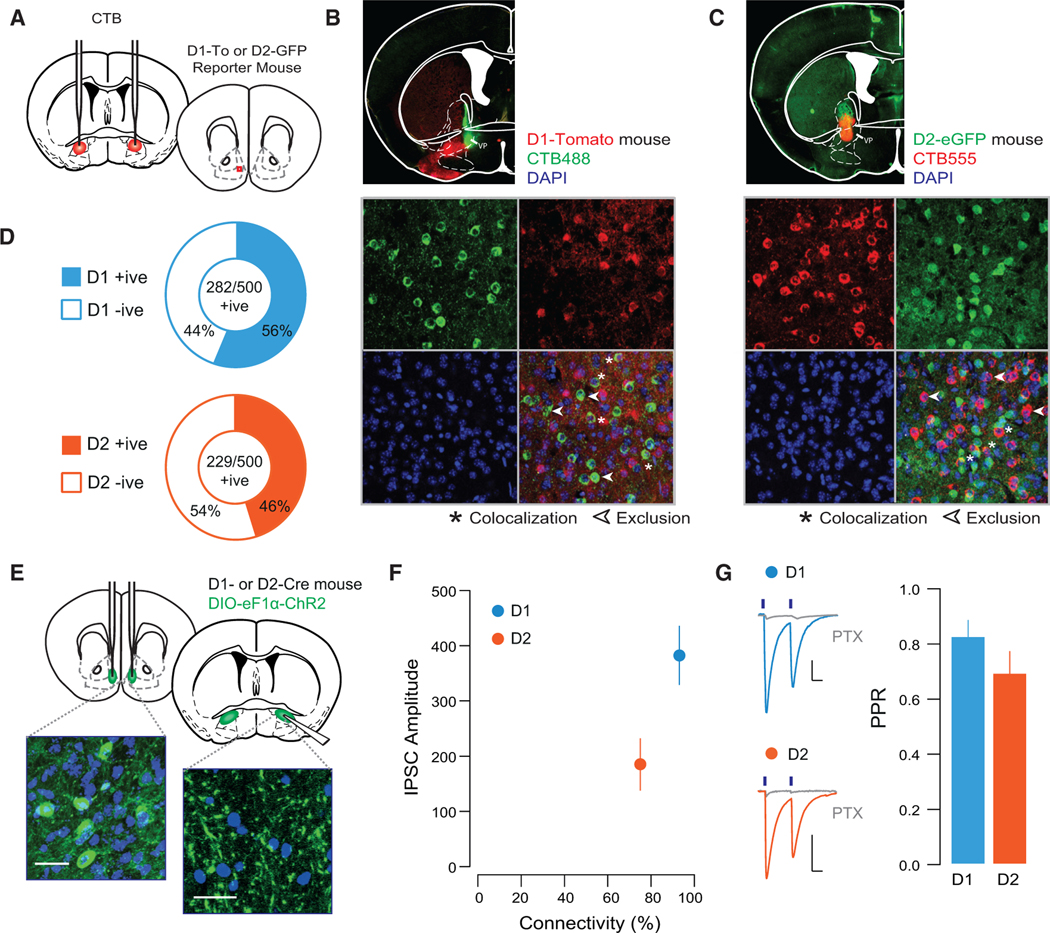
Figure 1. D1- and D2-MSN Projection to the VP.

(A) Schematic of experiment.
(B) Representative injection site of CTB488 into the VP (top) and 40× confocal images of sections of the NAc shell of D1-TdTomato mice.
(C) Injection site of CTB555 into the VP (top) and 40× confocal images of sections of the NAc shell of D2-eGFP mice (n = 250 cells from 2 mice of each genotype).
(D) Quantification of CTB-positive cells based on their co-expression with reporter protein; in D1-TdTomato mice, 56% of CTB-positive cells (five sections/mouse from two mice) co-localized with TdTomato, while in D2-eGFP mice, 46% of CTB-positive cells co-localized with the D2-eGFP protein (five sections/mouse from two mice).
(E) Schematic and 40× confocal images of injection site in the NAc shell floxed-channelrhodpsin, and terminal fields in the VP (scale bars, 50 μM).
(F) Connectivity plot summarizing optogenetic circuit mapping. In the VP, 92.8% of neurons were innervated by D1-MSNs (83 cells from 4 mice; averageconnectivity strength, 382.5 ± 53.7 pA), whereas 75.0% received innervation from D2-MSNs (56 cells from 4 mice; average connectivity strength, 184.9 ± 47.2 pA).
(G) Currents blocked by picrotoxin (PTX; 20 μM). There was no difference in the PPR between D1- and D2-VP synapses (D1, 0.75 ± 0.05; D2, 0.82 ± 0.09; t = 0.655, p = 0.514).
