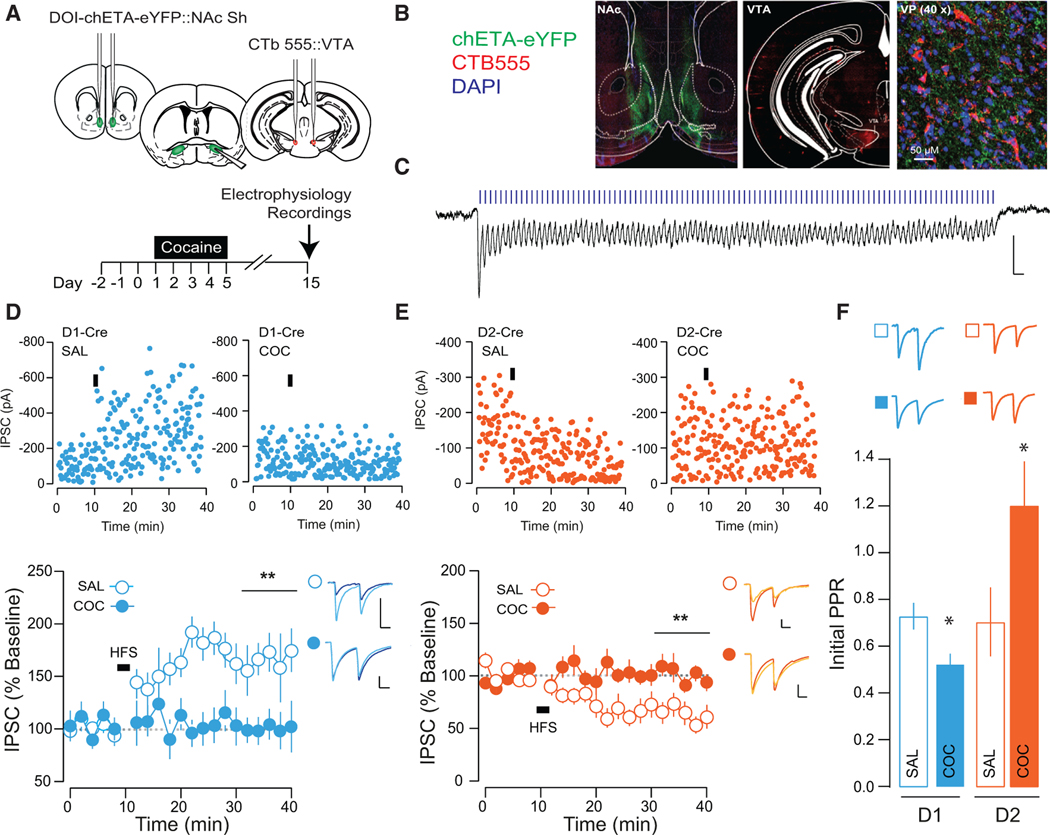
Figure 2. Cocaine Occludes Bidirectional Plasticity at NAc-to-VP Synapses.
(A) Schematic of experiment.
(B) Representative section of ChR2 infection site in the NAc (left), and CTB seeding in the VTA (middle). Section (40×) of the VP showing labeled fibers opposing CTB-positive VP cells (left).
(C) IPSC recorded in VP cell during 100 Hz light stimulation.
(D) In saline-treated D1-Cre mice, HFS induced an LTP at NAc-VP synapses. HFS failed to induce LTP in cocaine-treated mice (saline [SAL], 181.16% ± 30.19%, 4 cells from 2 mice; cocaine [COC], 100.35% ± 18.53%, 8 cells from 3 mice). Representative traces (baseline, light blue; post-LTP, dark blue), single-cell examples (top), and group data (bottom) are shown.
(E) In saline-treated D2-Cre mice, HFS induced an LTD at NAc-VP synapses. HFS failed to induce LTD in cocaine-treated mice (SAL, 62.95% ± 11.61%, 10 cells from 3 mice; COC, 100.05% ± 5.95%, 10 cells from 3 mice). Representative examples of single-cell experiments (top) and group data (bottom) are shown.
(F) PPR was not different between D1- and D2-MSN-to-VP synapses in saline-treated mice (D1-MSNs, 0.733 ± 0.057, 10 cells from 3 mice; D2-MSNs, 0.708 ± 0.148, 10 cells from 3 mice). Relative to saline-treated mice, PPR was decreased in D1-MSNs (D1-MSNs, 0.530 ± 0.043, 10 cells from 3 mice; t = 2.84, p = 0.011) and increased in D2-MSNs (D2-MSNs, 1.207% ± 0.188%, 10 cells from 3 mice; t = 2.09, p = 0.051) in cocaine-treated mice.
*p < 0.05; all plots mean ± SEM. For representative traces, baseline (20 trials) and final 20 sweeps of recording are shown. All scale bars, 50 pA, 20 ms. Related to Figures S1–S3.

