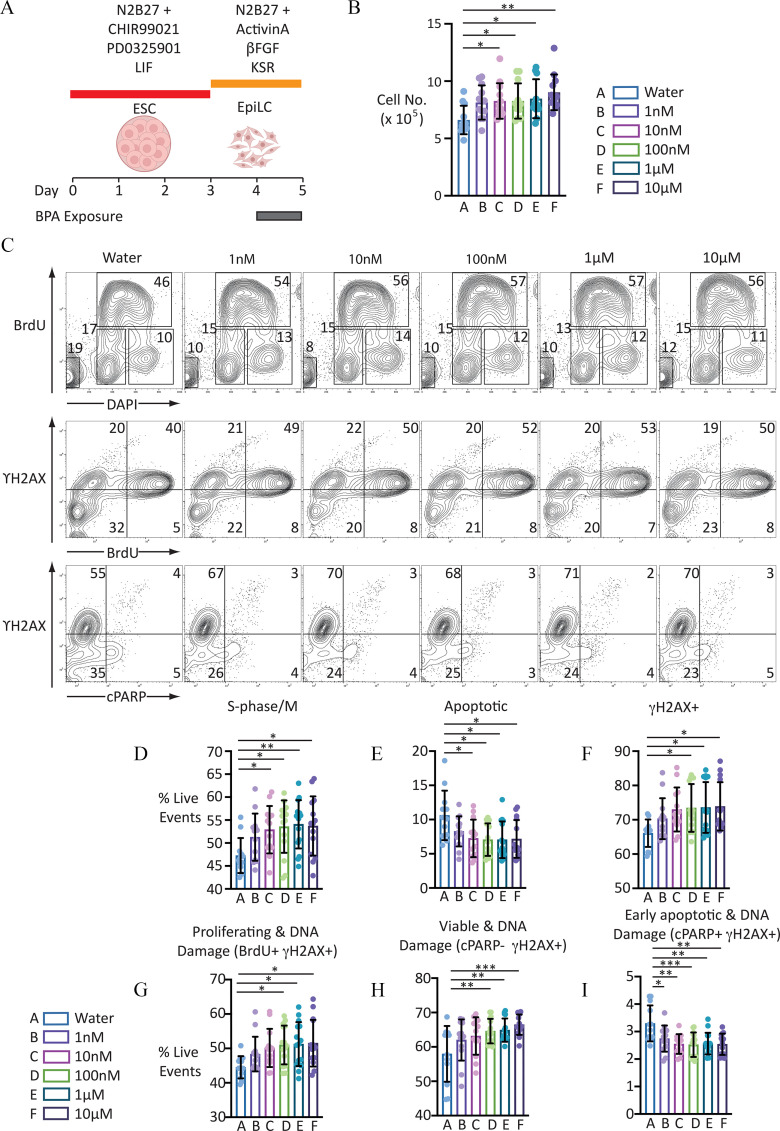
Figure 1.
Proliferation analysis of EpiLCs to BPA for 24 h. (A) Graphic illustrating BPA exposure and cell differentiation strategy. [Illustration in part created with ©BioRender (biorender.com), per the Biorender terms and conditions.] (B) Scatter-bar plot indicating cell counts of EpiLCs exposed to the different BPA concentrations indicated: error bars represent . for each condition. One-way ANOVA . One-way ANOVA with Šidák-adjusted -values for comparison to control: (vs. ); (vs. ); (vs. ); (vs. ); and (vs. ). For numerical values of data, see Excel Table S2. (C) Representative FACS contour plots showing distribution of live-gated events. First row indicates cell staining profile following incubation with DAPI and proliferation, measured using anti-BrdU antibody following a 30-min pulse with the thymidine analogue BrdU. Second row indicates distribution of proliferating cells labeled with anti- antibody, a marker of DNA damage. Third panel indicates distribution of cells labeled with antibody and anti-cPARP antibody, a marker of apoptosis. Numbers indicate proportion of live-gated events within the regions indicated. (D–I) Scatter-bar plots indicating proportion of live-gated events in the different populations indicated. Data indicate . . For complete set of one-way ANOVA and calculated one-way ANOVA with Šidák-adjusted -values for each treatment condition compared with control, see Table 1. For numerical values of data, see Excel Table S7. Note: ANOVA, analysis of variance; , basic fibroblast growth factor; BPA, bisphenol A; DAPI, 4′,6-diamidino-2-phenylindole; ESC, embryonic stem cell; EpiLC, epiblast-like cell; FACS, fluorescence-activated cell sorting; LIF, leukemia inhibitory factor; KSR, knockout serum replacement. Number of asterisks on plots indicate level of statistical significance: *(); **(); ***().

