. 2021 Sep 29;129(9):097013. doi: 10.1289/EHP8196

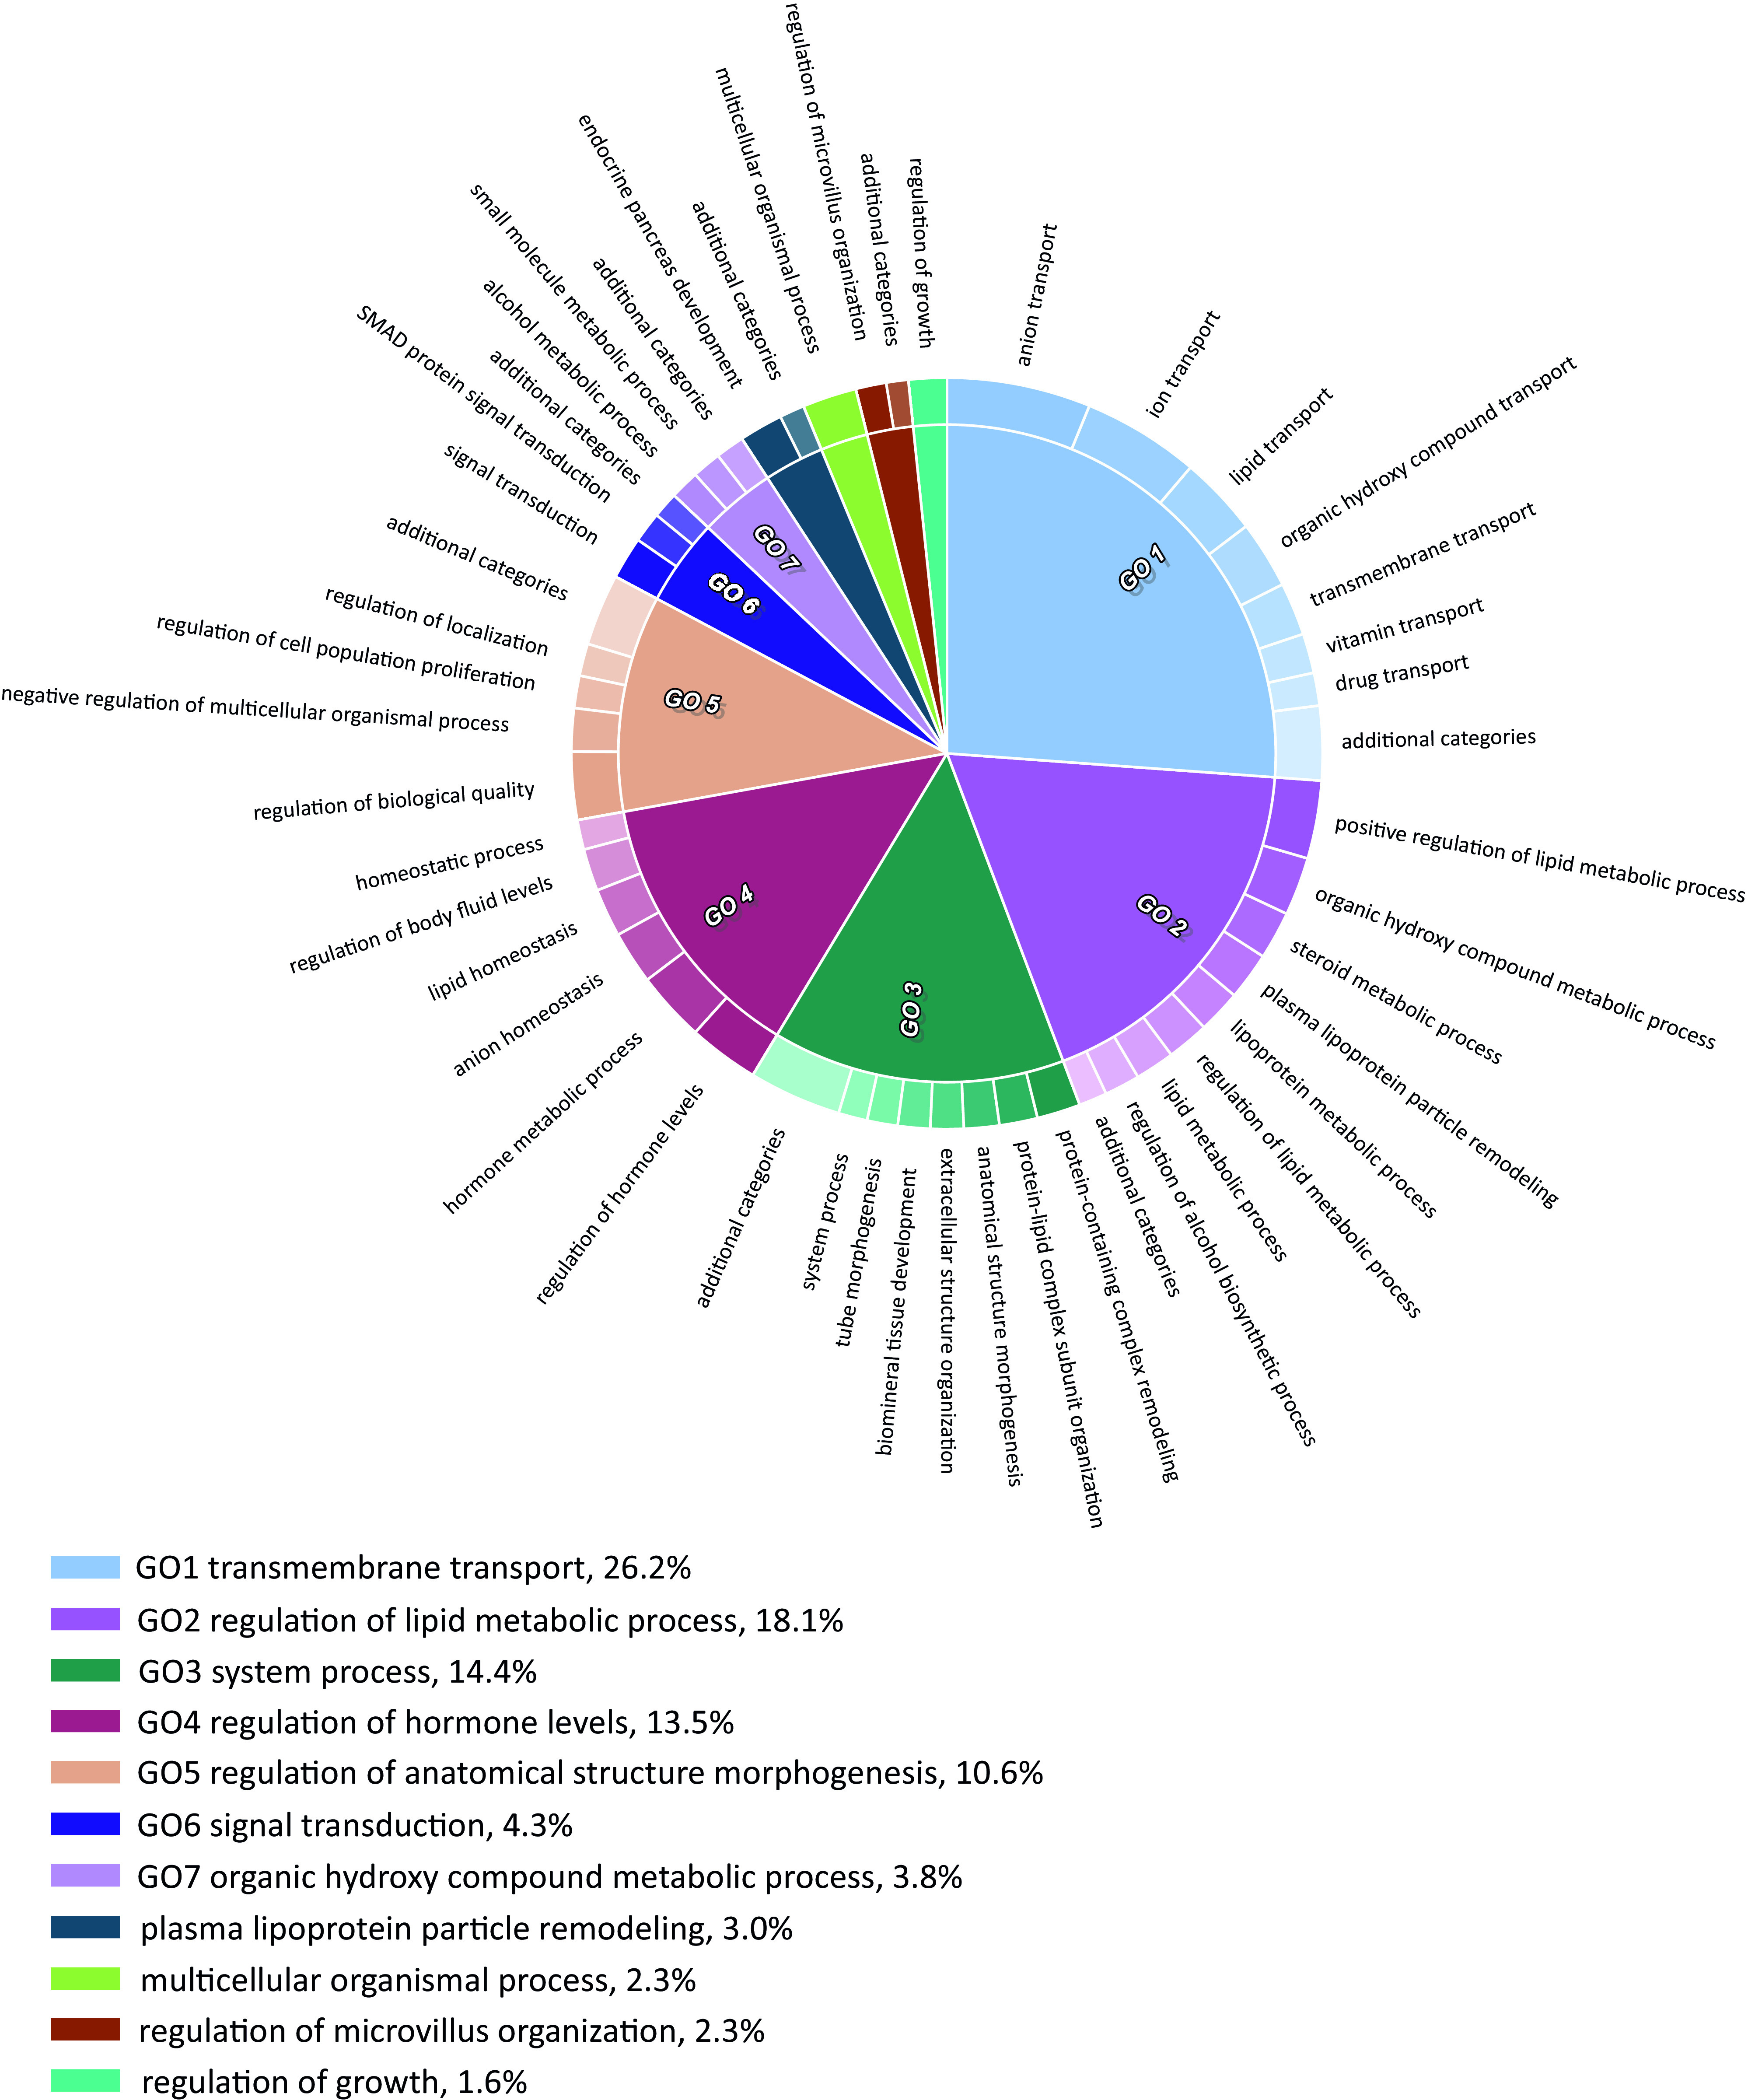
Figure 4.

Figure 4 is a pie chart plotting anion transport, ion transport, lipid transport, organic hydroxyl compound transport, transmembrane transport, vitamin transport, drug transport, additional categories, positive regulation of lipid metabolic process, organic hydroxy compound metabolic process, steroid metabolic process, plasma lipoprotein particle remodeling, lipoprotein metabolic process, regulation of lipid metabolic process, lipid metabolic process, regulation of alcohol biosynthetic process, additional categories, protein-containing complex remodeling, protein-lipid complex subunit organization, anatomical structure morphogenesis, extracellular structure organization, biomineral tissue development, tube morphogenesis, system process, additional categories, regulation of hormone levels, hormone metabolic process, anion homeostasis, lipid homeostasis, regulation of body fluid levels, homeostatic process, regulation of biological quality, negative regulation of multicellular organismal process, regulation of cell population proliferation, regulation of localization, additional categories, signal transduction, S M A D protein signal transduction, additional categories, alcohol metabolic process, small molecule metabolic process, additional categories, endocrine pancreas development, additional categories, multicellular organismal process, regulation of microvillus organization, additional categories, and regulation of growth. Anion transport, ion transport, lipid transport, organic hydroxyl compound transport, transmembrane transport, vitamin transport, drug transport, additional categories represent G O1 transmembrane transport, 26.2 percent; positive regulation of lipid metabolic process, organic hydroxy compound metabolic process, steroid metabolic process, plasma lipoprotein particle remodeling, lipoprotein metabolic process, regulation of lipid metabolic process, lipid metabolic process, regulation of alcohol biosynthetic process, additional categories represent G O2 regulation of lipid metabolic process, 18.1 percent; protein-containing complex remodeling, protein-lipid complex subunit organization, anatomical structure morphogenesis, extracellular structure organization, biomineral tissue development, tube morphogenesis, system process, additional categories represent G O3 system process, 14.4 percent; regulation of hormone levels, hormone metabolic process, anion homeostasis, lipid homeostasis, regulation of body fluid levels, homeostatic process represent G O4 regulation of hormone levels, 13.5 percent; regulation of biological quality, negative regulation of multicellular organismal process, regulation of cell population proliferation, regulation of localization, additional categories represent G O5 regulation of anatomical structure morphogenesis, 10.6 percent; signal transduction, S M A D protein signal transduction, additional categories represent G O6 signal transduction, 4.3 percent; alcohol metabolic process, small molecule metabolic process, additional categories represent G O7 organic hydroxy compound metabolic process, 3.8 percent; endocrine pancreas development, additional categories represent plasma lipoprotein particle remodeling, 3.0 percent, multicellular organismal process represent multicellular organismal process, 2.3 percent; regulation of microvillus organization, additional categories represent regulation of microvillus organization, 2.3 percent; and regulation of growth represent regulation of growth, 1.6 percent.

GO biological processes categories enriched in genes up-regulated in day 5 (d5) DP/ PGCLCs, derived from 100nM BPA-exposed EpiLCs. CirGO plots showing parent representative records (inner ring) and child, description records (outer ring). For calculated p-values, see Excel Table S17. Note: BPA, bisphenol A; DP, double positive; EpiLC, epiblast-like cell; GO, gene ontology; PGC, primordial germ cell; PGCLC, PGC-like cell.