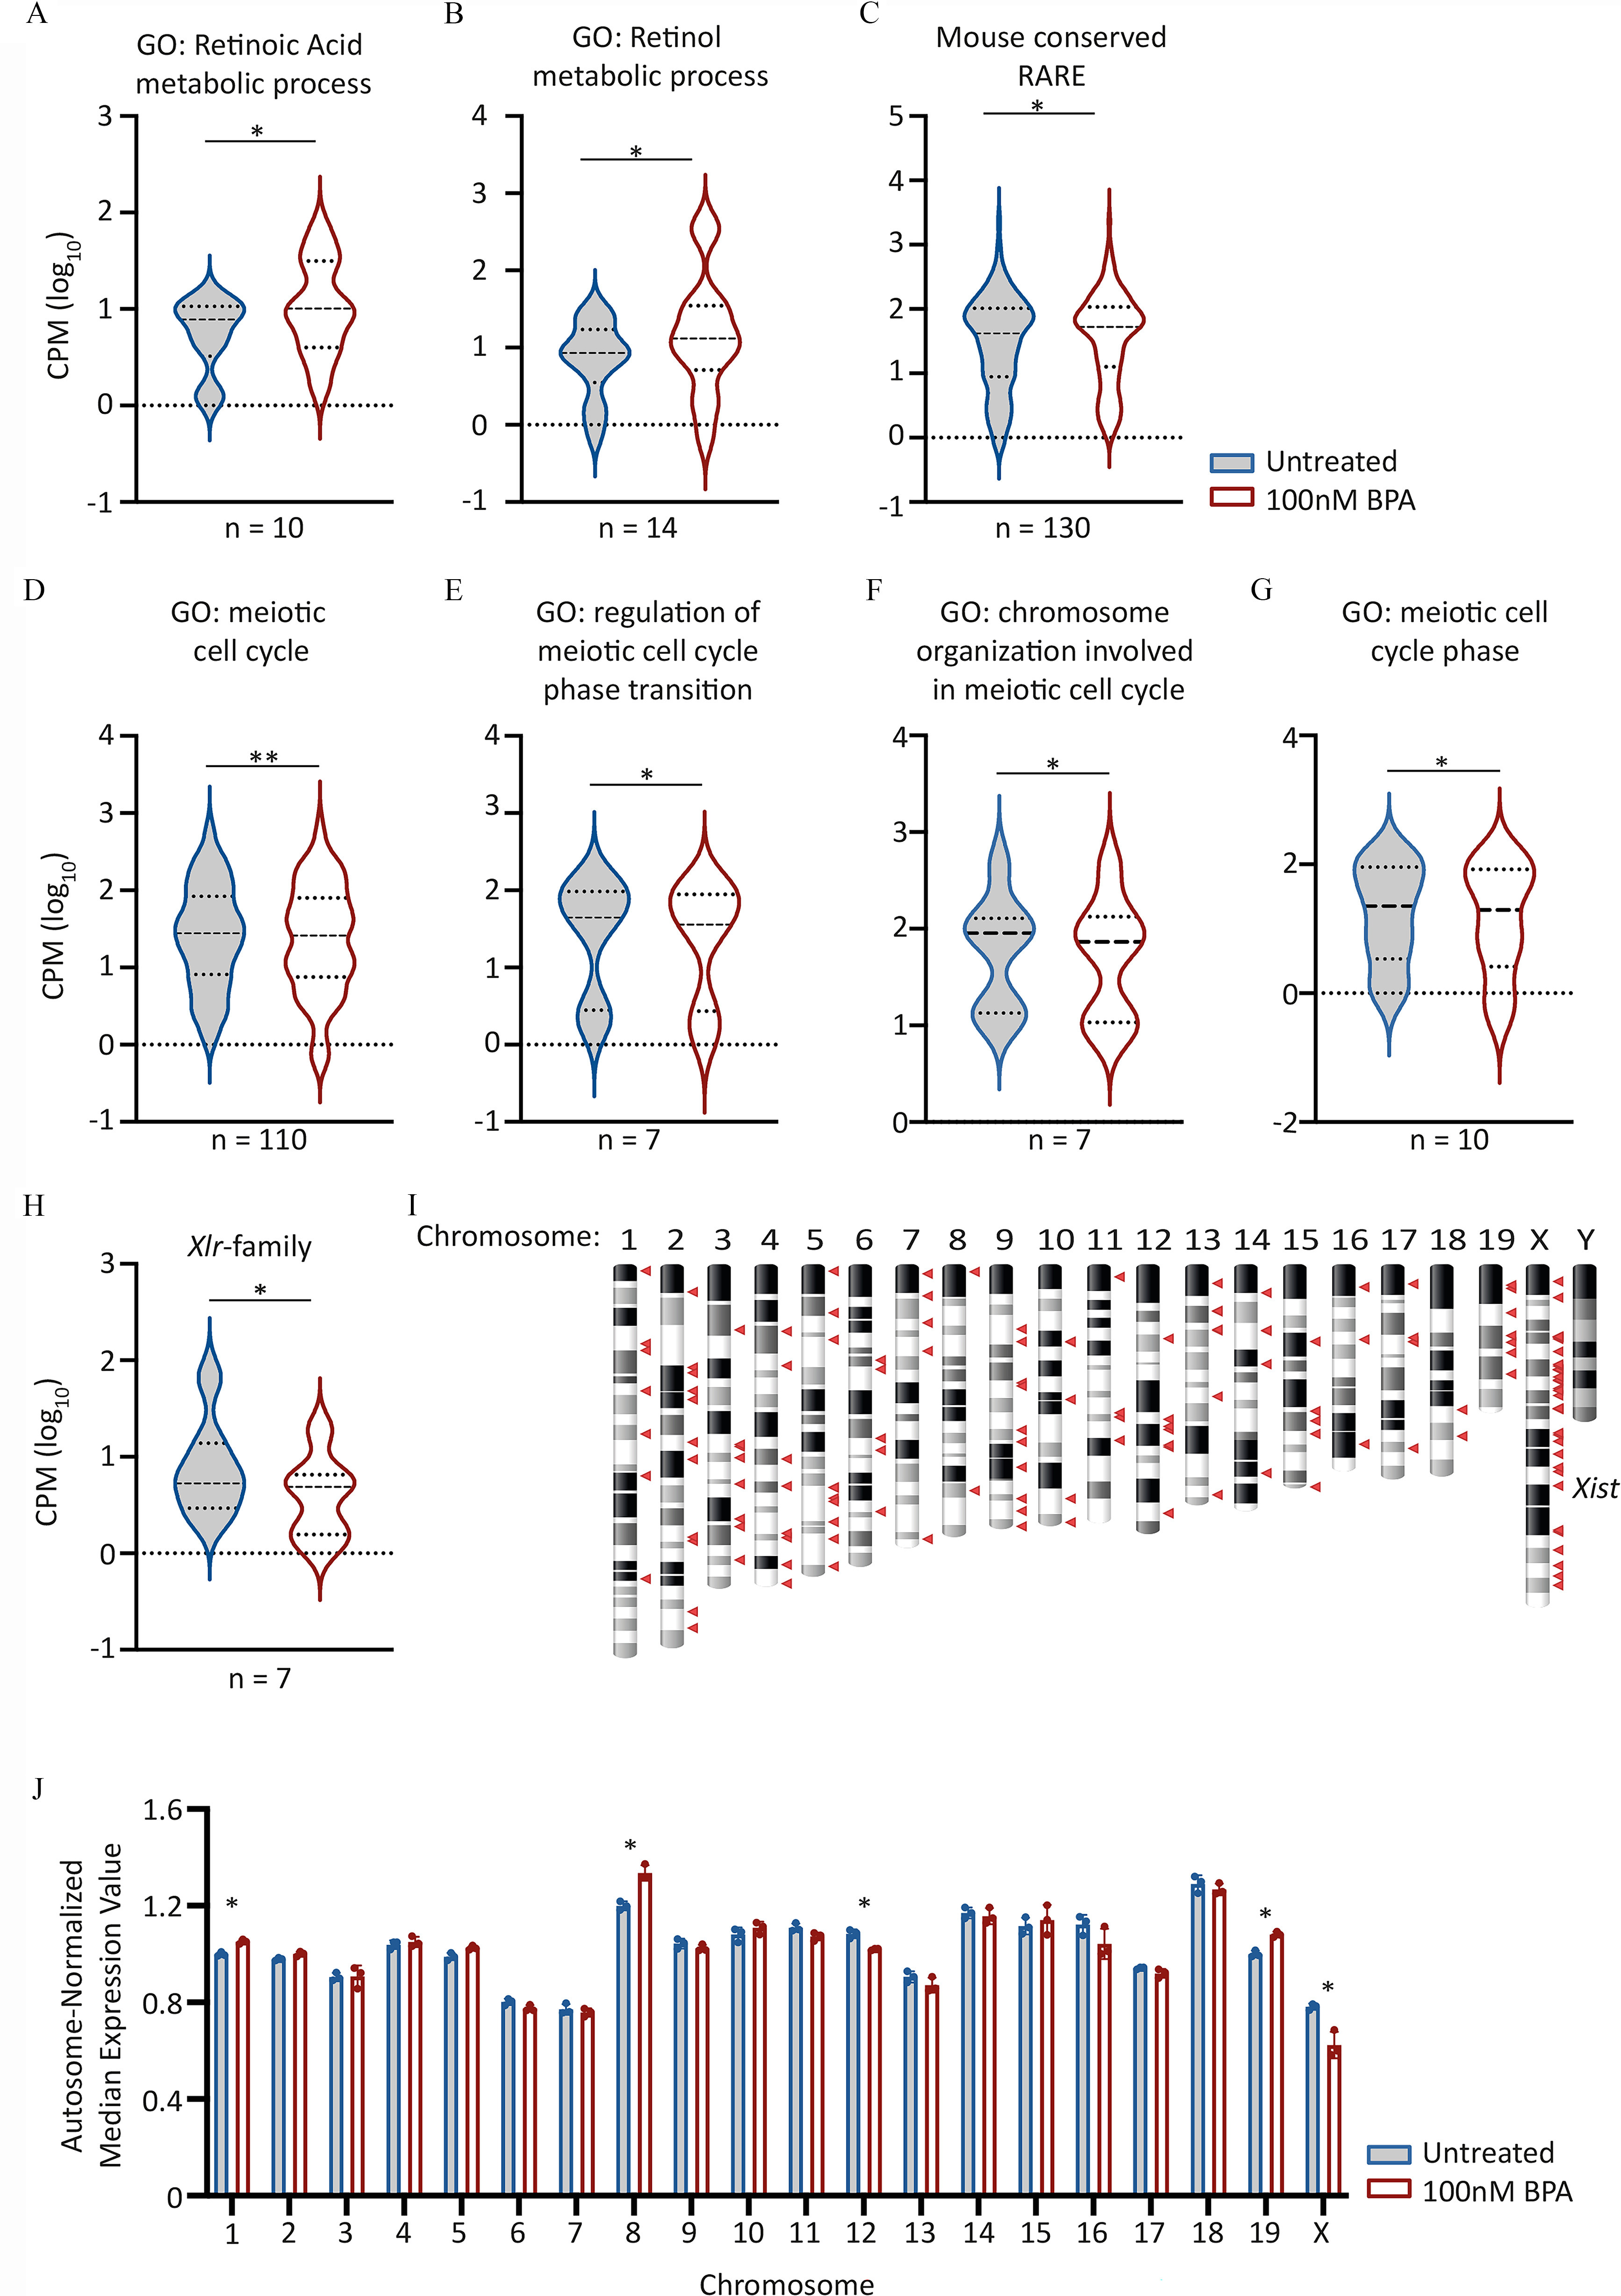
Figure 5.

Candidate gene expression analysis in day 5 (d5) PGCLCs derived from EpiLCs exposed to BPA. (A–H) Violin plots showing aggregated expression levels () for the different gene sets listed. Lines indicate median and quartiles. For Wilcoxon matched pairs signed rank test -values, see Table 4. GO biological process terms listed were obtained from http://www.informatics.jax.org/vocab/gene_ontology/GO:0,008,150. Genes within 10 kb of RAREs, and conserved between Mus musculus genome and at least six other different species, including humans were obtained from Lalevée et al. (Lalevée et al. 2011). For full lists of genes analyzed expression values and p-values, see Excel Tables S18-S21. (I) Chromosome ideogram indicating chromosome location of down-regulated genes in d5 PGCLCs derived from BPA-exposed EpiLCs. Down-regulated genes defined as those with a fold change of and Benjamini-Hochberg-adjusted . Genes indicated by red triangles. (J) Scatter-bar plot showing autosome-normalized mean expression values for genes binned by chromosome. Median gene expression values for each chromosome was determined before normalizing by total autosomal gene expression value. Asterisks indicate chromosomes with differential expression values significantly different (Benjamini-Hochberg-adjusted ) between untreated and BPA exposed samples. For all plots, the first in the series represents “Untreated” followed by “ BPA exposed.” Note: BPA, bisphenol A; EpiLCs, epiblast-like cell; GO, gene ontology; RARE, retinoic acid response element; PGC, primordial germ cell; PGCLC, PGC-like cell.
