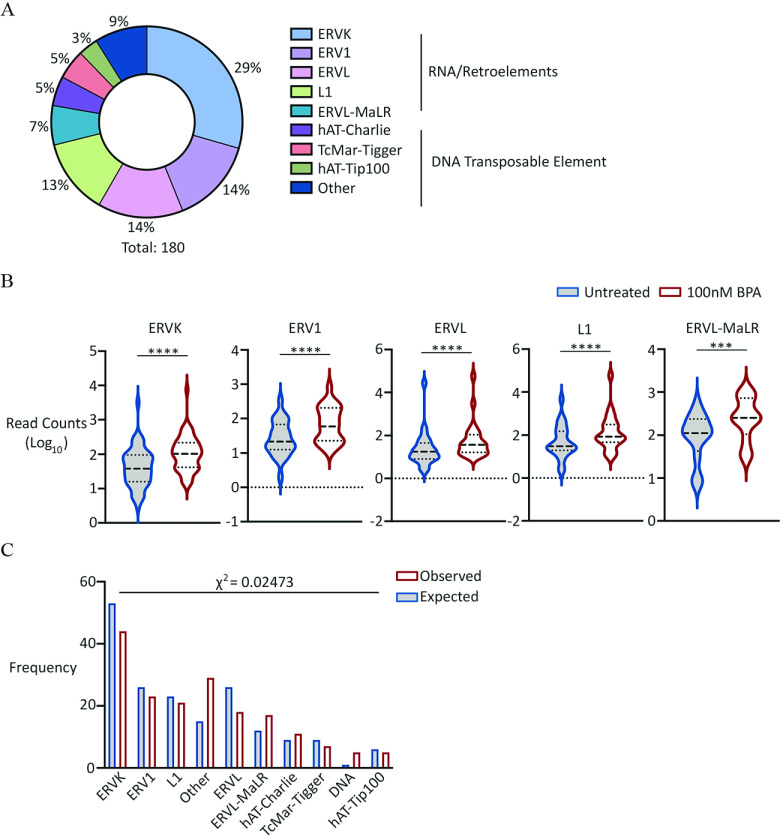
Figure 6.
Analysis of repeat DNA expression in PGCLCs derived from EpiLCs exposed to BPA. (A) Pie chart showing percentage distribution of different repeat families up-regulated in exposed germ cells. For full list of repeat families, see Excel Table S22. (B) Violin plots showing aggregate expression levels of different repeat families indicated, up-regulated in exposed germ cells. Dashed lines represent median and quartiles. Wilcoxon matched-pairs signed rank test -values: (ERVK, ERV1, ERVL and L1); for ERVL-MaR. First plot represents “Untreated” followed by “ exposed.” (C) Bar graph comparing observed with expected frequency of different repeat families indicated, up-regulated in exposed germ cells. Expected frequencies of each family calculated based on total number of upregulated repeat families and proportion occurrence in RepeatMasker database. First plot represents “Observed,” followed by “Expected” frequency. For the full list of up-regulated elements and repeat superfamilies, see Excel Tables S23 and S24, respectively. Note: BPA, bisphenol A; EpiLCs, epiblast-like cell; PGC, primordial germ cell; PGCLC, PGC-like cell.

