Fig. 5.
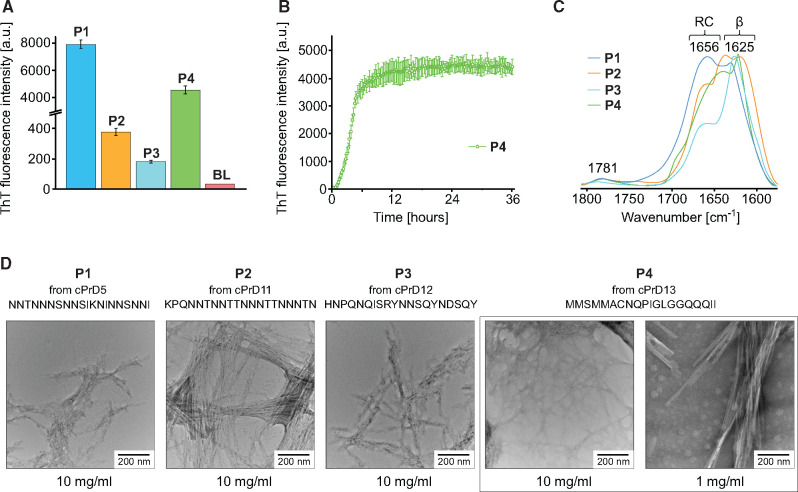
Analysis of aggregates formed by pRANK-peptides. (A) Histogram showing ThT fluorescence intensity levels of samples containing peptides derived from prion candidates OQD58440.1 (P1); WP_066970924.1 (P2); WP_066972153.1 (P3); WP_069282784.1(P4). Prior to measurement, samples with the composition: 2.5 mg ml−1 peptide, 0.05 M NaCl, 20 µM Th, H2O, pH around 3, were incubated for 24 h at 37°. Three independent measurements were made for each sample, which was the basis for calculating the mean and error bar. For comparison, the result for the blank is also presented (BL). (B) ThT fluorescence-monitored reassociation of WP_069282784.1 (P4) peptide. Sample composition and measurement conditions are the same as in the case of (A). (C) ATR−FTIR spectra of the amide I band region of samples containing pRANK-peptides. Before measurement, small portions of lyophilized peptides were suspended in water, which was then gently evaporated. (D) Micrographs of all four peptides tested obtained using a transmission electron microscope show the fibrillar morphology of the aggregates. Peptide WP_069282784.1 (P4) is shown in two different concentrations.

