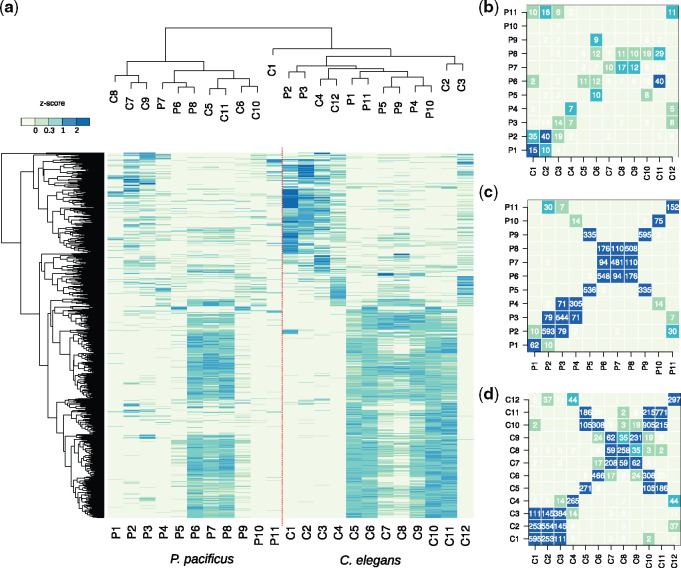
Fig. 2.
Limited conservation of highly spatially restricted expression. (a) The heatmap shows the median z-score-normalized expression values for one-to-one orthologs of regional genes in both species. Joint clustering of regions separates the germline from the rest of the worms. (b–d) The heatmaps show the numbers of shared one-to-one orthologs (b) or shared genes in Pristionchus pacificus (c) and Caenorhabditis elegans (d) between different regions. The color code scales with the significance of the overlap (Fisher’s exact test).

