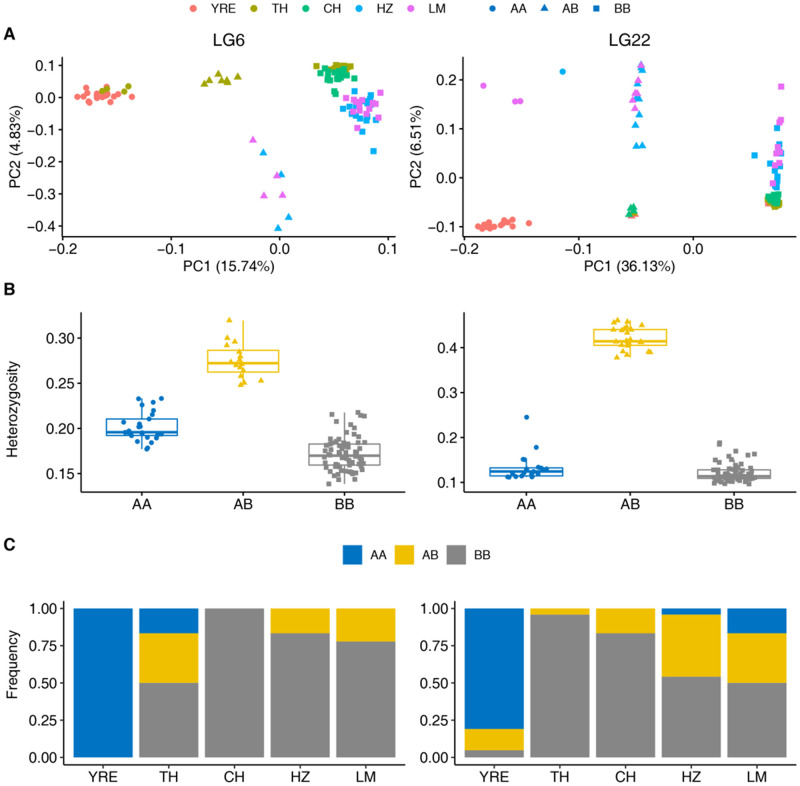
Fig. 3.
Characterizations of the two chromosome inversions on LG6 (left) and LG22 (right). (A) Scatter plots for PCA showing there are three distinct groups of individuals partitioned by PC1. Population origin of individuals is labeled by different colors. The three groups represented by different shapes correspond to three karyotypes: homokaryotypes for the reference arrangement (filled circle, AA), heterokaryotypes with both reference and alternative arrangements (filled triangle, AB), and homokaryotypes for the alternative inverted arrangement (filled square, BB). The group for homokaryotypes of the reference arrangement (AA) consists the majority of individuals from the anadromous population (YRE). The rearrangement karyotype for each individual is determined using PC1 of PCA based on the “k-means” algorithm. (B) Box plot for average heterozygosity of SNPs within the two chromosome inversions for individuals of the three groups identified by PCA. The heterokaryotypes (yellow filled triangle, AB) display the highest heterozygosity, whereas homokaryotypes (blue filled circle AA and gray filled square BB) show reduced heterozygosity. (C) Bar plot for karyotypic frequency of the two chromosome inversions in each population. The frequency of three karyotypes is represented by different colors: yellow for heterokaryotype AB, blue for homokaryotype AA, and gray for homokaryotype BB. YRE, Yangtze River Estuary; TH, Taihu Lake; CH, Chaohu Lake; HZ, Hongze Lake; LM, Luoma Lake.

