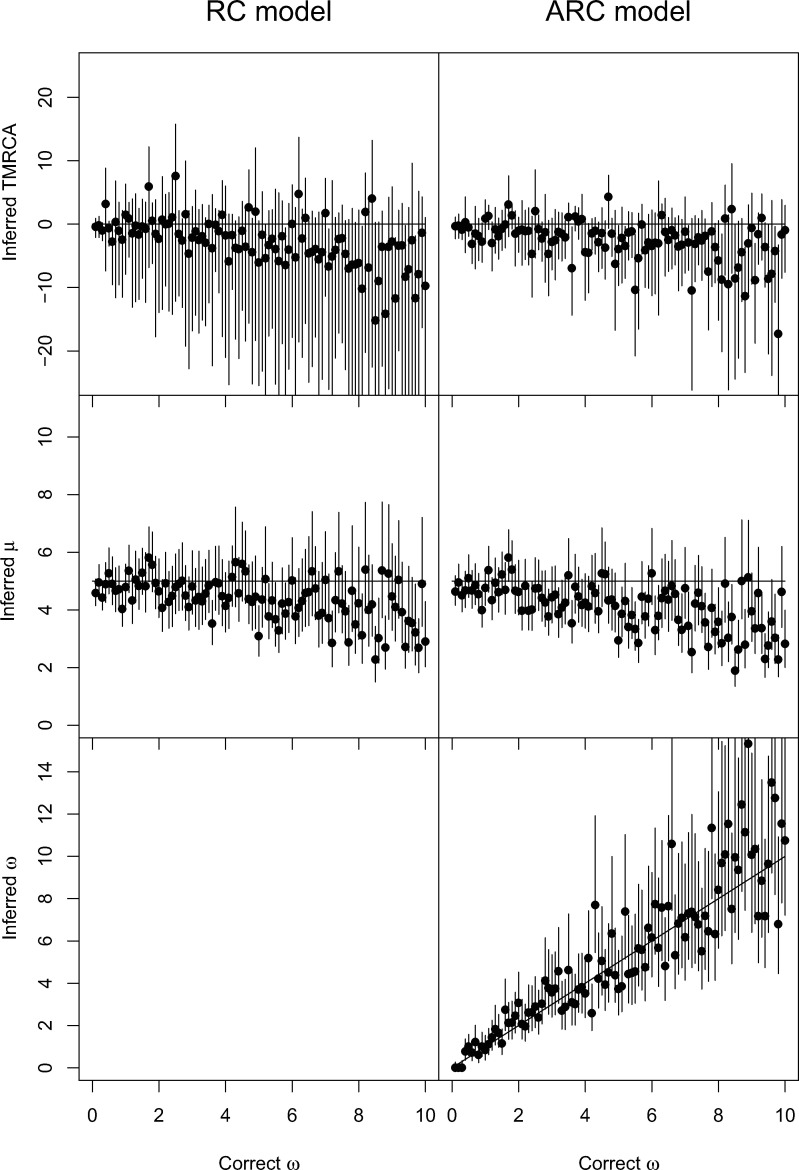
Fig. 2.
Application of BactDating to 100 simulated data sets. On the left, inference used the RC model and on the right, the ARC model. The top row shows inferred values of the TMRCA (relative to the correct value), the middle row shows inferred values of the mean mutation rate μ, and the bottom row shows inferred values of the relaxation parameter ω for the ARC model. In each plot, the x-axis represents the value of ω used in the simulations (varied between 0 and 10) and the y-axis represents the inferred values, with a dot for the posterior mean and a bar for the 95% credible interval.

