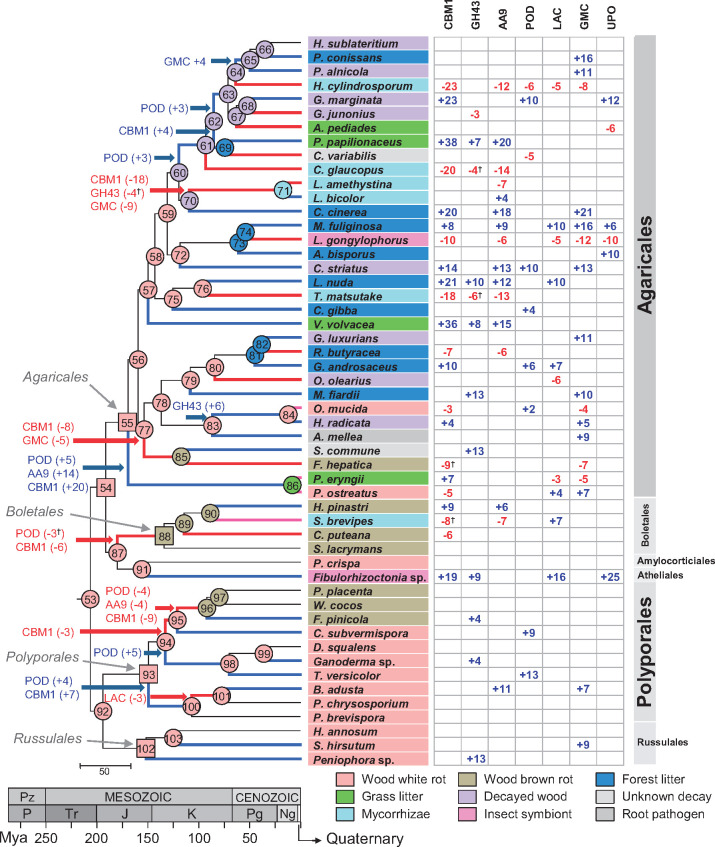
Fig. 4.
CAFE analysis revealing gene families with higher evolutionary rates in the phylogeny of the 52 species analyzed, and ancestral lifestyle predictions (as color codes at the tree nodes). Changes in gene-copy numbers estimated with CAFE in the seven families with significantly higher evolutionary rates (family-wide P < 0.01)—that is, POD, laccase (LAC), AA9 LPMO, GMC, UPO, GH43, and CBM1—in the different ancestral nodes (left) and in the last evolutionary step leading to the extant species (right) are shown. Blue and red branches indicate significant expansion and contraction of enzyme numbers (Viterbi P < 0.05) in blue and red font, respectively (magenta branches indicate that both expansions and contractions occurred). †Complete loss of a gene type. The ancestral lifestyles reconstruction, carried out with a trained wknn algorithm (Samworth 2012), was based on gene numbers for the above seven families predicted by CAFE at the 53–103 nodes of the species tree. The nodes of the MRCAs of the Agaricomycetidae (node 54), Agaricales (node 55), Boletales (node 88), Polyporales (node 93), and Russulales (node 102) are shown as squares, whereas the rest of nodes are shown as circles (the predicted lifestyles are indicated by color codes).

