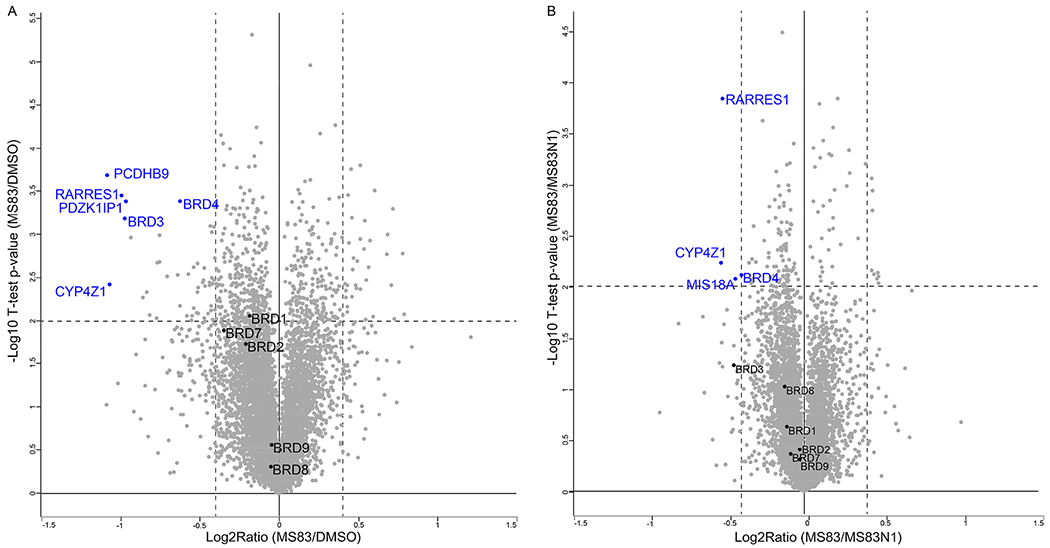
Figure 4.

Quantitative MS-based proteomic analysis indicates that MS83 selectively degrades BRD4 and BRD3 over other BRDs in MDA-MB-468 cells. MDA-MB-468 cells were treated with 0.1% DMSO, 0.5 μM of MS83, or 0.5 μM of MS83N1 for 48 h before they were harvested for TMT-based mass spectrometry analysis. Volcano plots of the −log 10 (p value) versus the log 2-fold change are displayed for (A) MS83 versus DMSO and (B) MS83 versus MS83N1. Several proteins that were significantly downregulated by the MS83 treatment are labeled in blue (FDR = 0.01). P values were calculated from the data of two technical replicates with two-sample t test statistics.
