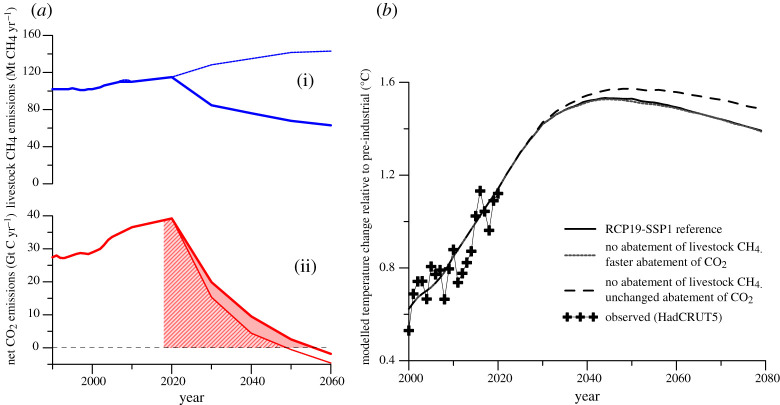
Figure 2.
Emission pathways of livestock CH4 (a(i)) and net CO2 (a(ii)) consistent with limiting warming to 1.5° with no or limited overshoot, and modelled temperature outcomes (b). The default emission pathways (solid lines) are the same as in figure 1. The dotted lines are for a business-as-usual scenario with a roughly 30% increase in livestock CH4 emissions by 2050 (relative to 2010), and net CO2 emissions adjusted such that the modelled temperature change remains virtually identical. Shaded and hashed areas in a(ii) indicate the remaining carbon budget for those pathways (starting in 2018; for details, see text). (b) Temperature responses, including for a scenario where livestock CH4 emissions are not reduced and emissions from all other sectors remain unchanged (dashed line). Temperature has been modelled using MAGICC 6.3 [44], using the median of a probabilistic set of 600 runs. Observed temperature change to 2020 is shown for illustration (crosses), using 1986–2005 as reference level, using HadCRUT5 [50]. (Online version in colour.)

