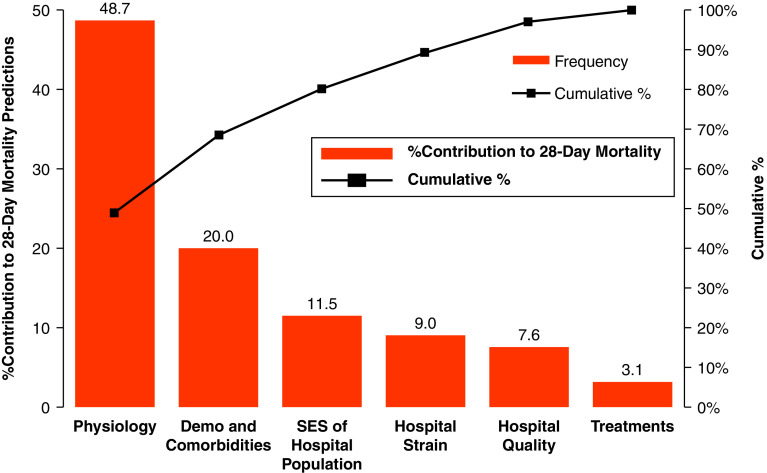
Figure 2.
Contributions to 28-day mortality risk based on Shapley values. The figure illustrates the relative contribution of all variables in each domain based on Shapley values calculated from the XGBoost machine learning model (red bars; left y-axis). The cumulative contribution of the domains, moving from left to right in the figure, is shown with the line plot (right y-axis). Demo = demographics; SES = socioeconomic status.

