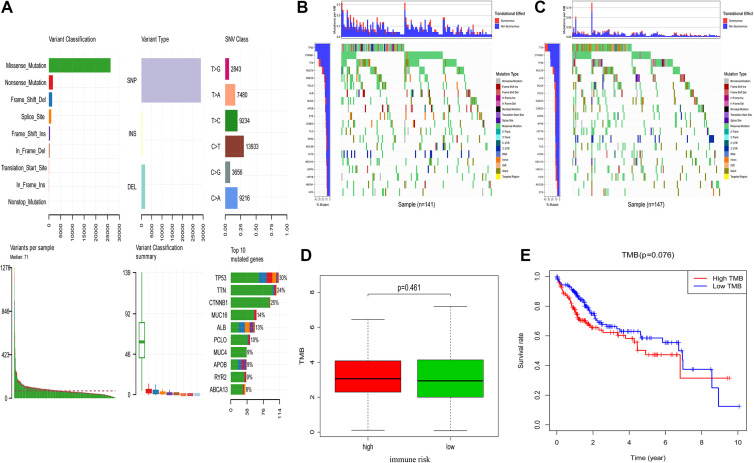
Figure 6.
High- and low-risk HCC patient mutation profiles and TMB values. (A) Summarized mutational data from 327 patients. (B, C) Mutational frequencies in the top 20 genes in the training and testing cohorts. (D) The relationship between immune-related risk scores and TMB. (E) The OS of high- and low-risk TMB liver cancer patient groups was assessed using Kaplan-Meier curves.

