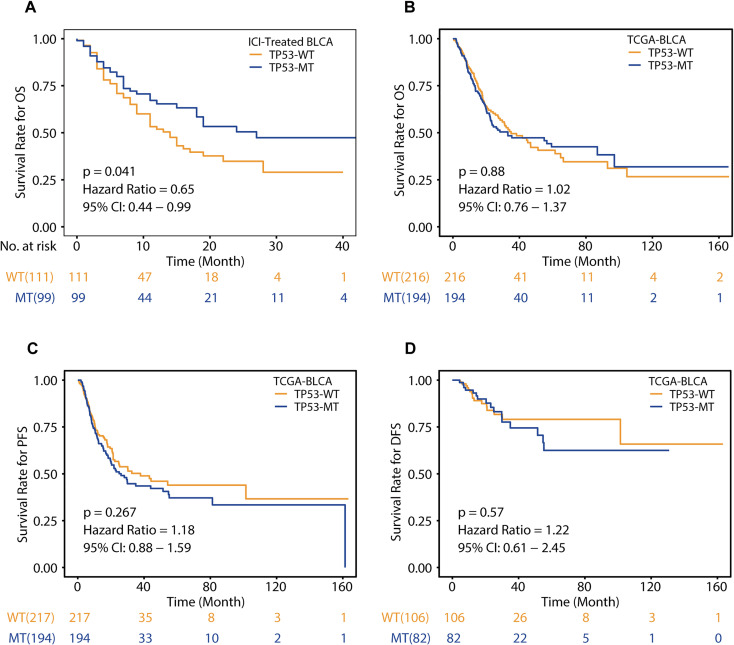
Figure 1.
Associations of the TP53 mutation status and clinical outcomes. A, Kaplan-Meier survival curves of overall survival (OS) in the immunotherapy cohort comparing patients with TP53-MT and patients with TP53-WT. B-D, Kaplan-Meier survival curves of overall survival (OS), progression-free survival (PFS) and disease-free survival (DFS) in the TCGA-BLCA cohort comparing patients with TP53-MT and patients with TP53-WT. A-D, Differences between the TP53-MT and TP53-WT groups were tested using the log-rank test.

