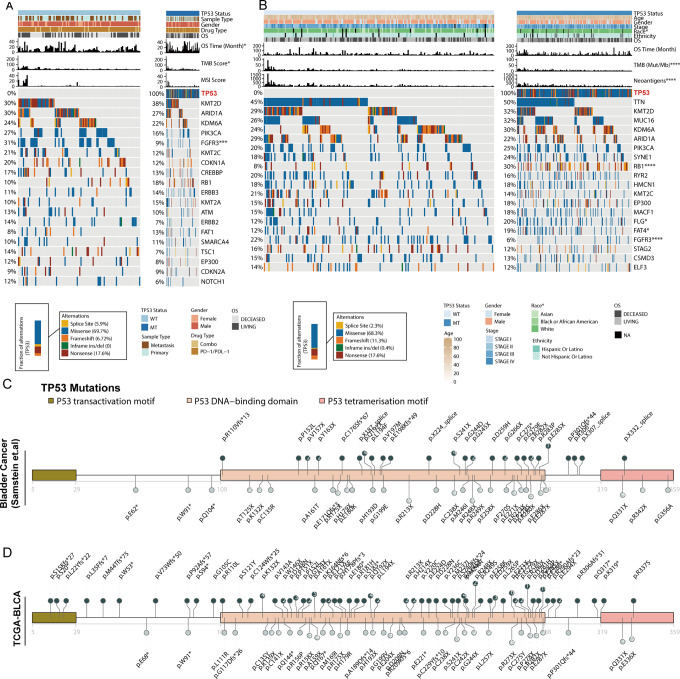
Figure 2.
Landscape of genomic alterations and lollipop charts of TP53 mutation sites. A, Two hundred ten BLCA samples from the immunotherapy cohort with mutation data grouped by the TP53 mutation status and mutation profile, with clinical and molecular features annotated above. B, Four hundred twelve BLCA samples from the TCGA-BLCA cohort with mutation data grouped by the TP53 mutation status and mutation profile, with clinical and molecular features annotated above. C-D, Amino acid positions of TP53 mutations in the immunotherapy cohort (C) and TCGA-BLCA cohort (D). Number in circles represent the frequency of the corresponding site mutation. Asterisks indicate the relationship with the TP53 mutation status (the TMB, the NAL, age and the MSI score were tested using the Mann-Whitney U test; the top 20 currently mutated genes in the TCGA-BLCA cohort were tested using the chi-Square test, and those in the immunotherapy cohort were tested using Fisher’s exact test; and sex, race, ethnicity and disease stage in the TCGA-BLCA cohort were tested using Fisher’s exact test. ****p < 0.0001, ***p < 0.001, **p < 0.01, *p < 0.05). TMB: tumor mutational burden; NAL: neoantigen load; MSI: microsatellite instability.

