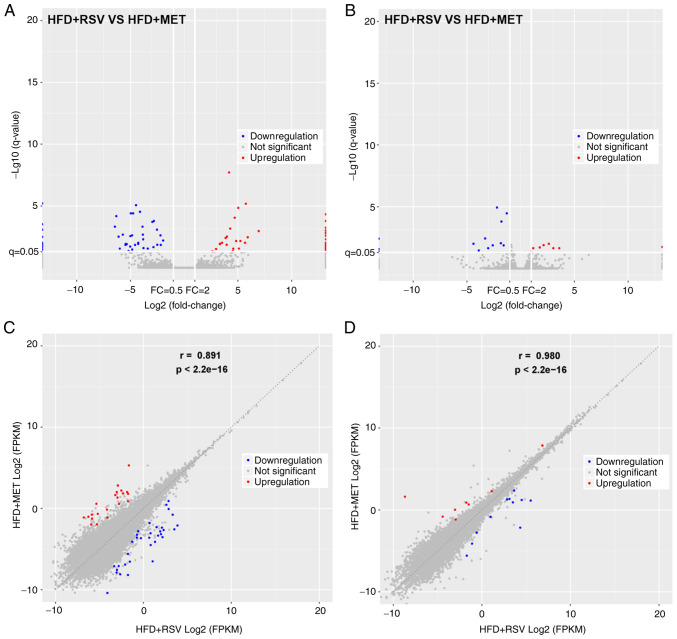
Figure 4.
(A and B) Volcano and (C and D) scatter plots of the variations in lncRNAs and mRNAs between the HFD + RSV and HFD + MET groups. (A and C) lncRNAs; (B and D) mRNAs. Red dots represent lncRNAs (or mRNAs) with P<0.05 and fold change ≥2; blue dots represent lncRNAs (or mRNAs) with P<0.05 and fold change ≤2. RSV, resveratrol; MET, metformin; HFD, high-fat diet; lncRNA, long non-coding RNA.

