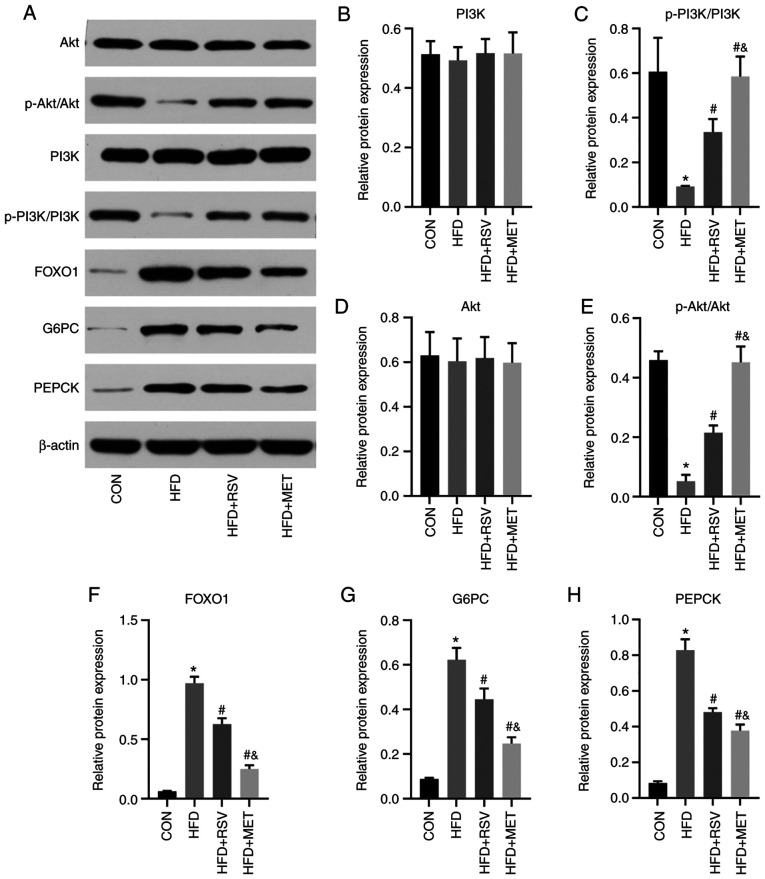
Figure 8.
Relative protein expression of PI3K/Akt signaling pathway-related indicators in mouse liver. (A) Protein bands of PI3K-Akt signal pathway molecules; (B) PI3K; (C) p-PI3K/PI3k; (D) Akt; (E) p -Akt/Akt; (F) FOXO1; (G) G6PC; (H) PEPCK. Data are presented as the mean ± SD (n=3). One-way analysis of variance was used for statistical analysis followed by Tukey's or Tamhane's multiple comparison tests. *P<0.05 vs. CON; #P<0.05 vs. HFD; &P<0.05 vs. HFD + RSV. RSV, resveratrol; MET, metformin; HFD, high-fat diet; FOXO1, forkhead box O1; G6PC, glucose-6-phosphatase catalytic subunit 1; PEPCK, phosphoenolpyruvate carboxykinase 1.

